
Country roads, take me home: Rugged areas have a higher share of rural residents
- by Elizabeth A. Dobis and John Cromartie
- 10/16/2023
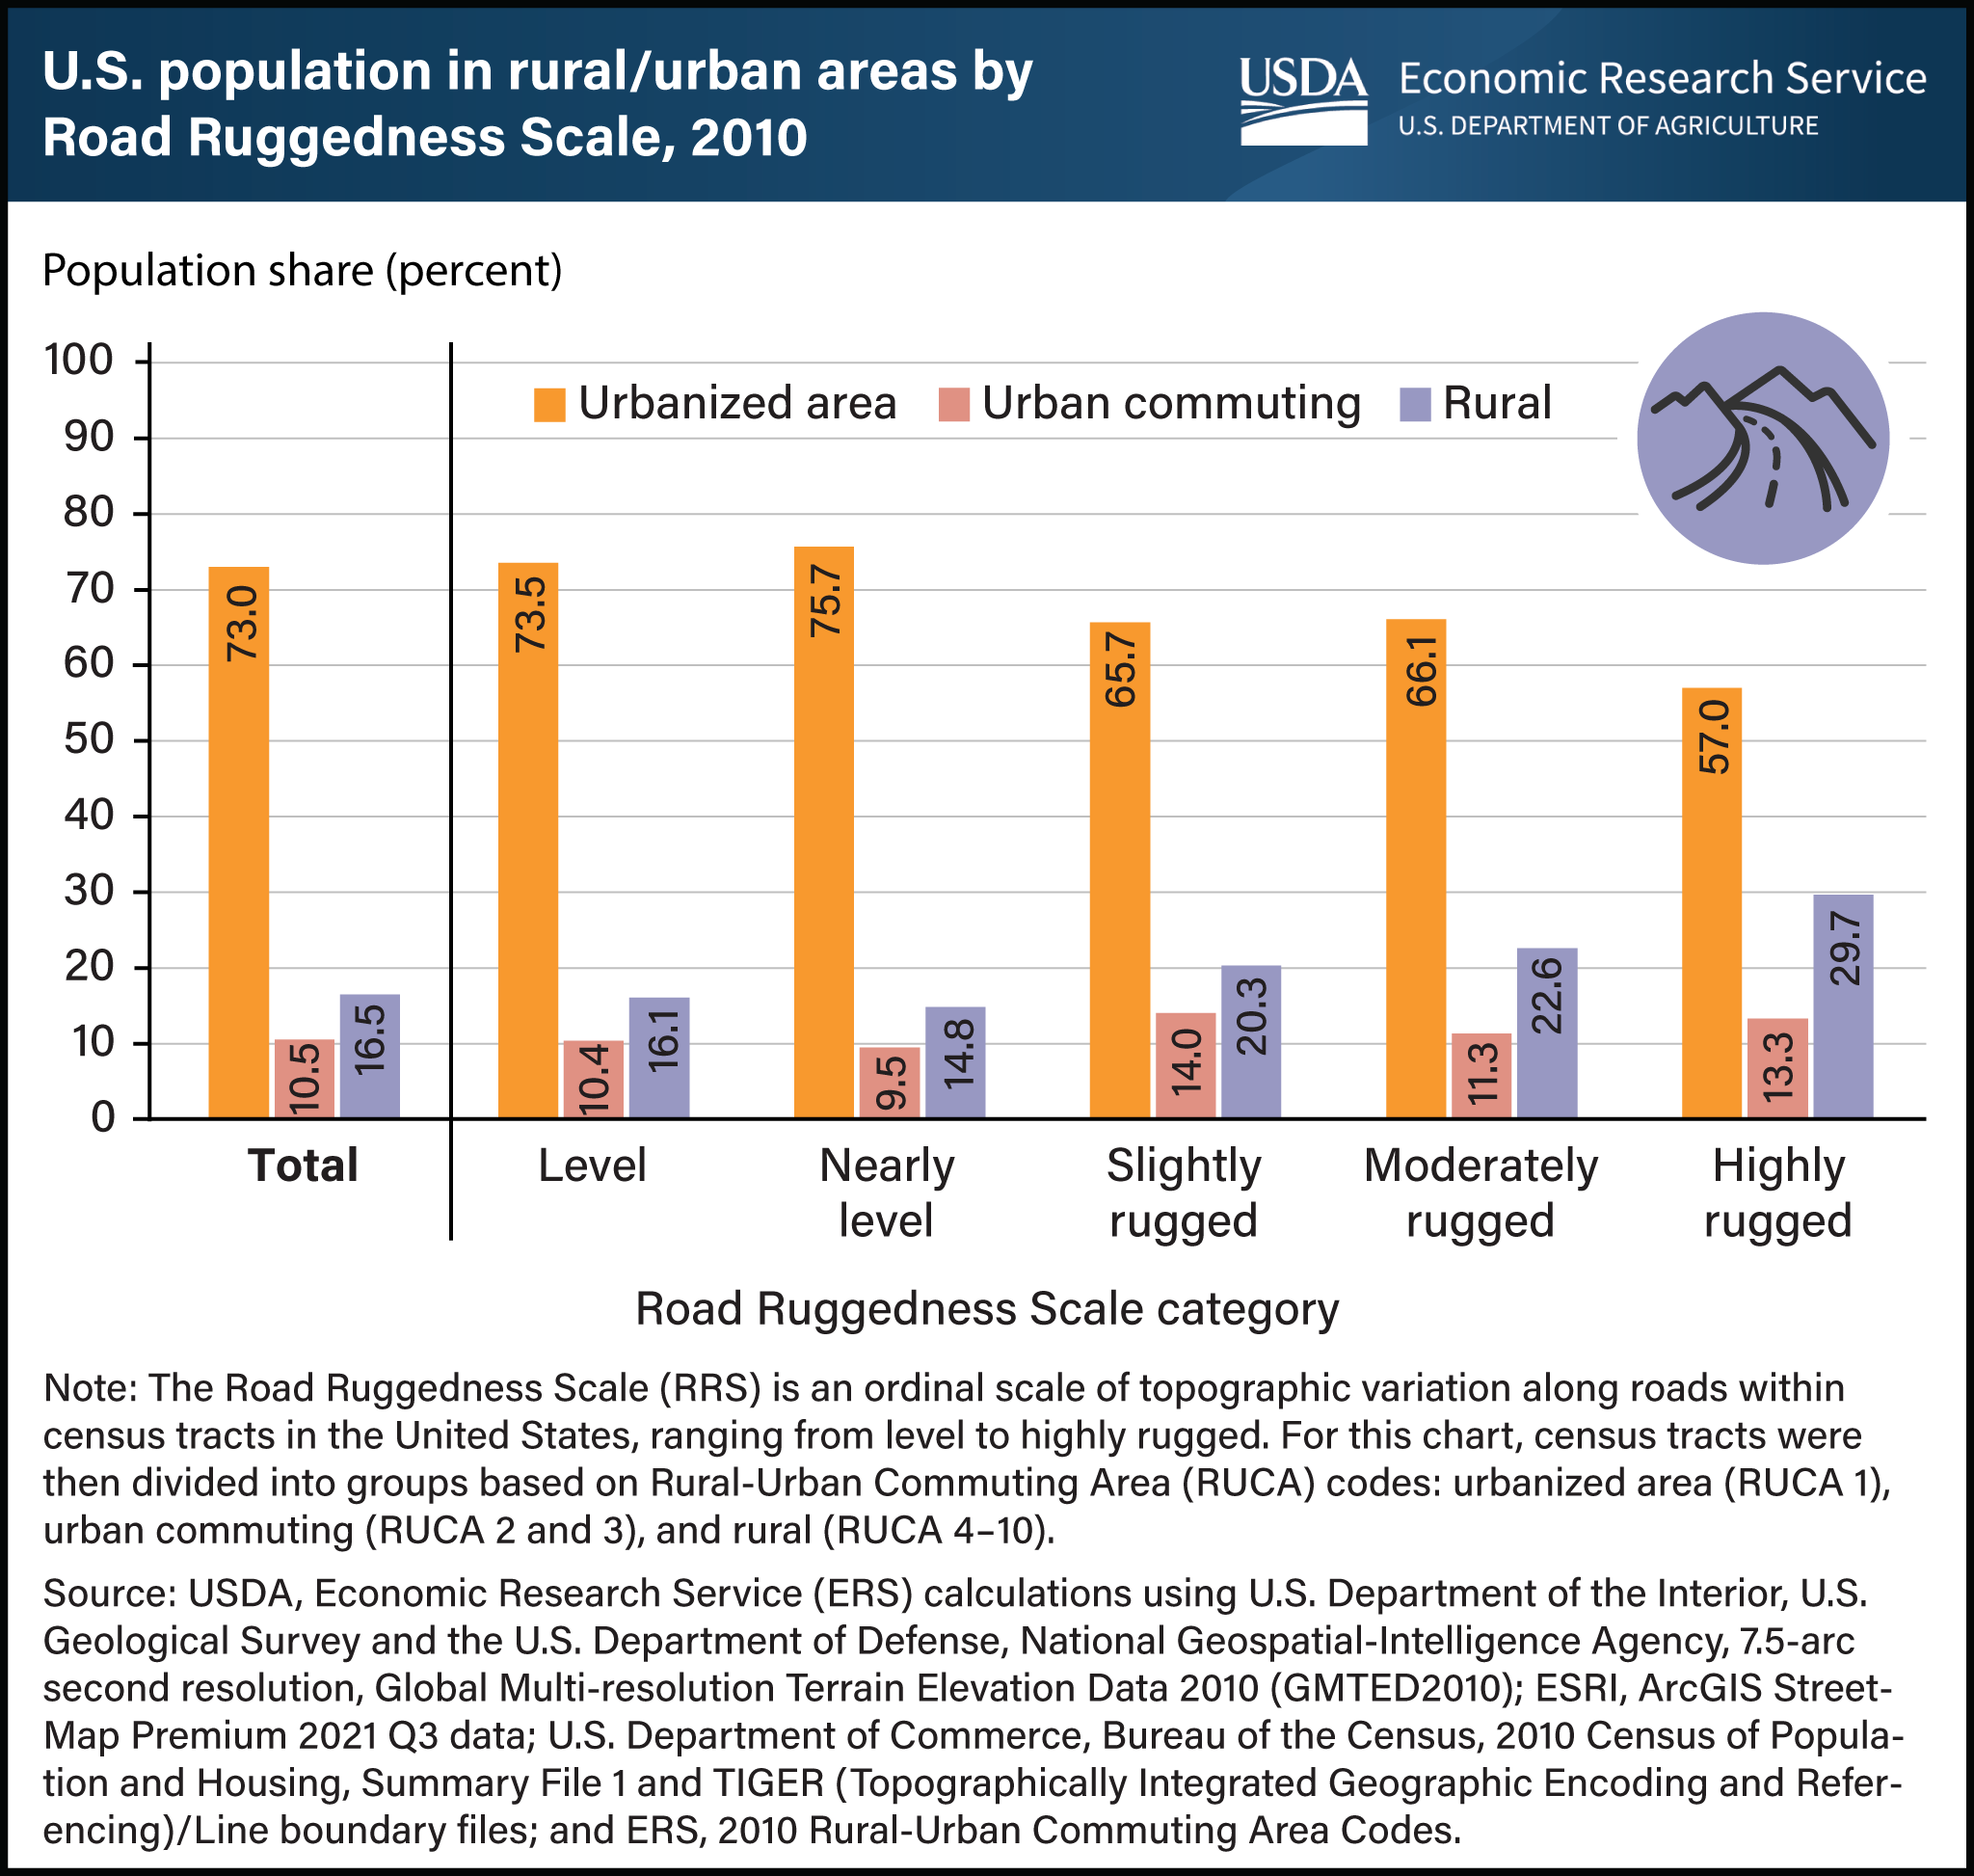
Researchers with USDA, Economic Research Service (ERS) developed the Road Ruggedness Scale—a five-category measure of topographic variability along roads—and used it to study the interplay of population, rurality, and ruggedness in the United States. They found that in 2010, as land became more rugged (had greater changes in elevation), generally more of the population lived in rural census tracts (the small geographic areas used to collect population data). For example, in level census tracts, the rural portion of residents was 16.1 percent, while the rural portion living in highly rugged census tracts was nearly double that amount (29.7 percent). The reverse was true for urbanized area census tracts, with the share of residents decreasing from 73.5 percent in level locations to 57.0 percent in highly rugged ones. However, even in the top ruggedness categories, most people lived in urbanized area census tracts, indicating that ruggedness and rurality are not synonymous. The relationship between ruggedness and rurality also varies by region. The rural population share in highly rugged census tracts of the Intermountain West (57.7 percent) and Appalachian Mountains (45.7 percent) was much higher than the national share of 29.7 percent, while the share in the Pacific Coast was much lower (18.6 percent). This chart appears in the ERS report Characterizing Rugged Terrain in the United States published on August 1, 2023.