
Grapefruit and oranges drove decline in U.S. fresh citrus availability from 1970 to 2022
- by Andrzej Blazejczyk
- 7/5/2023
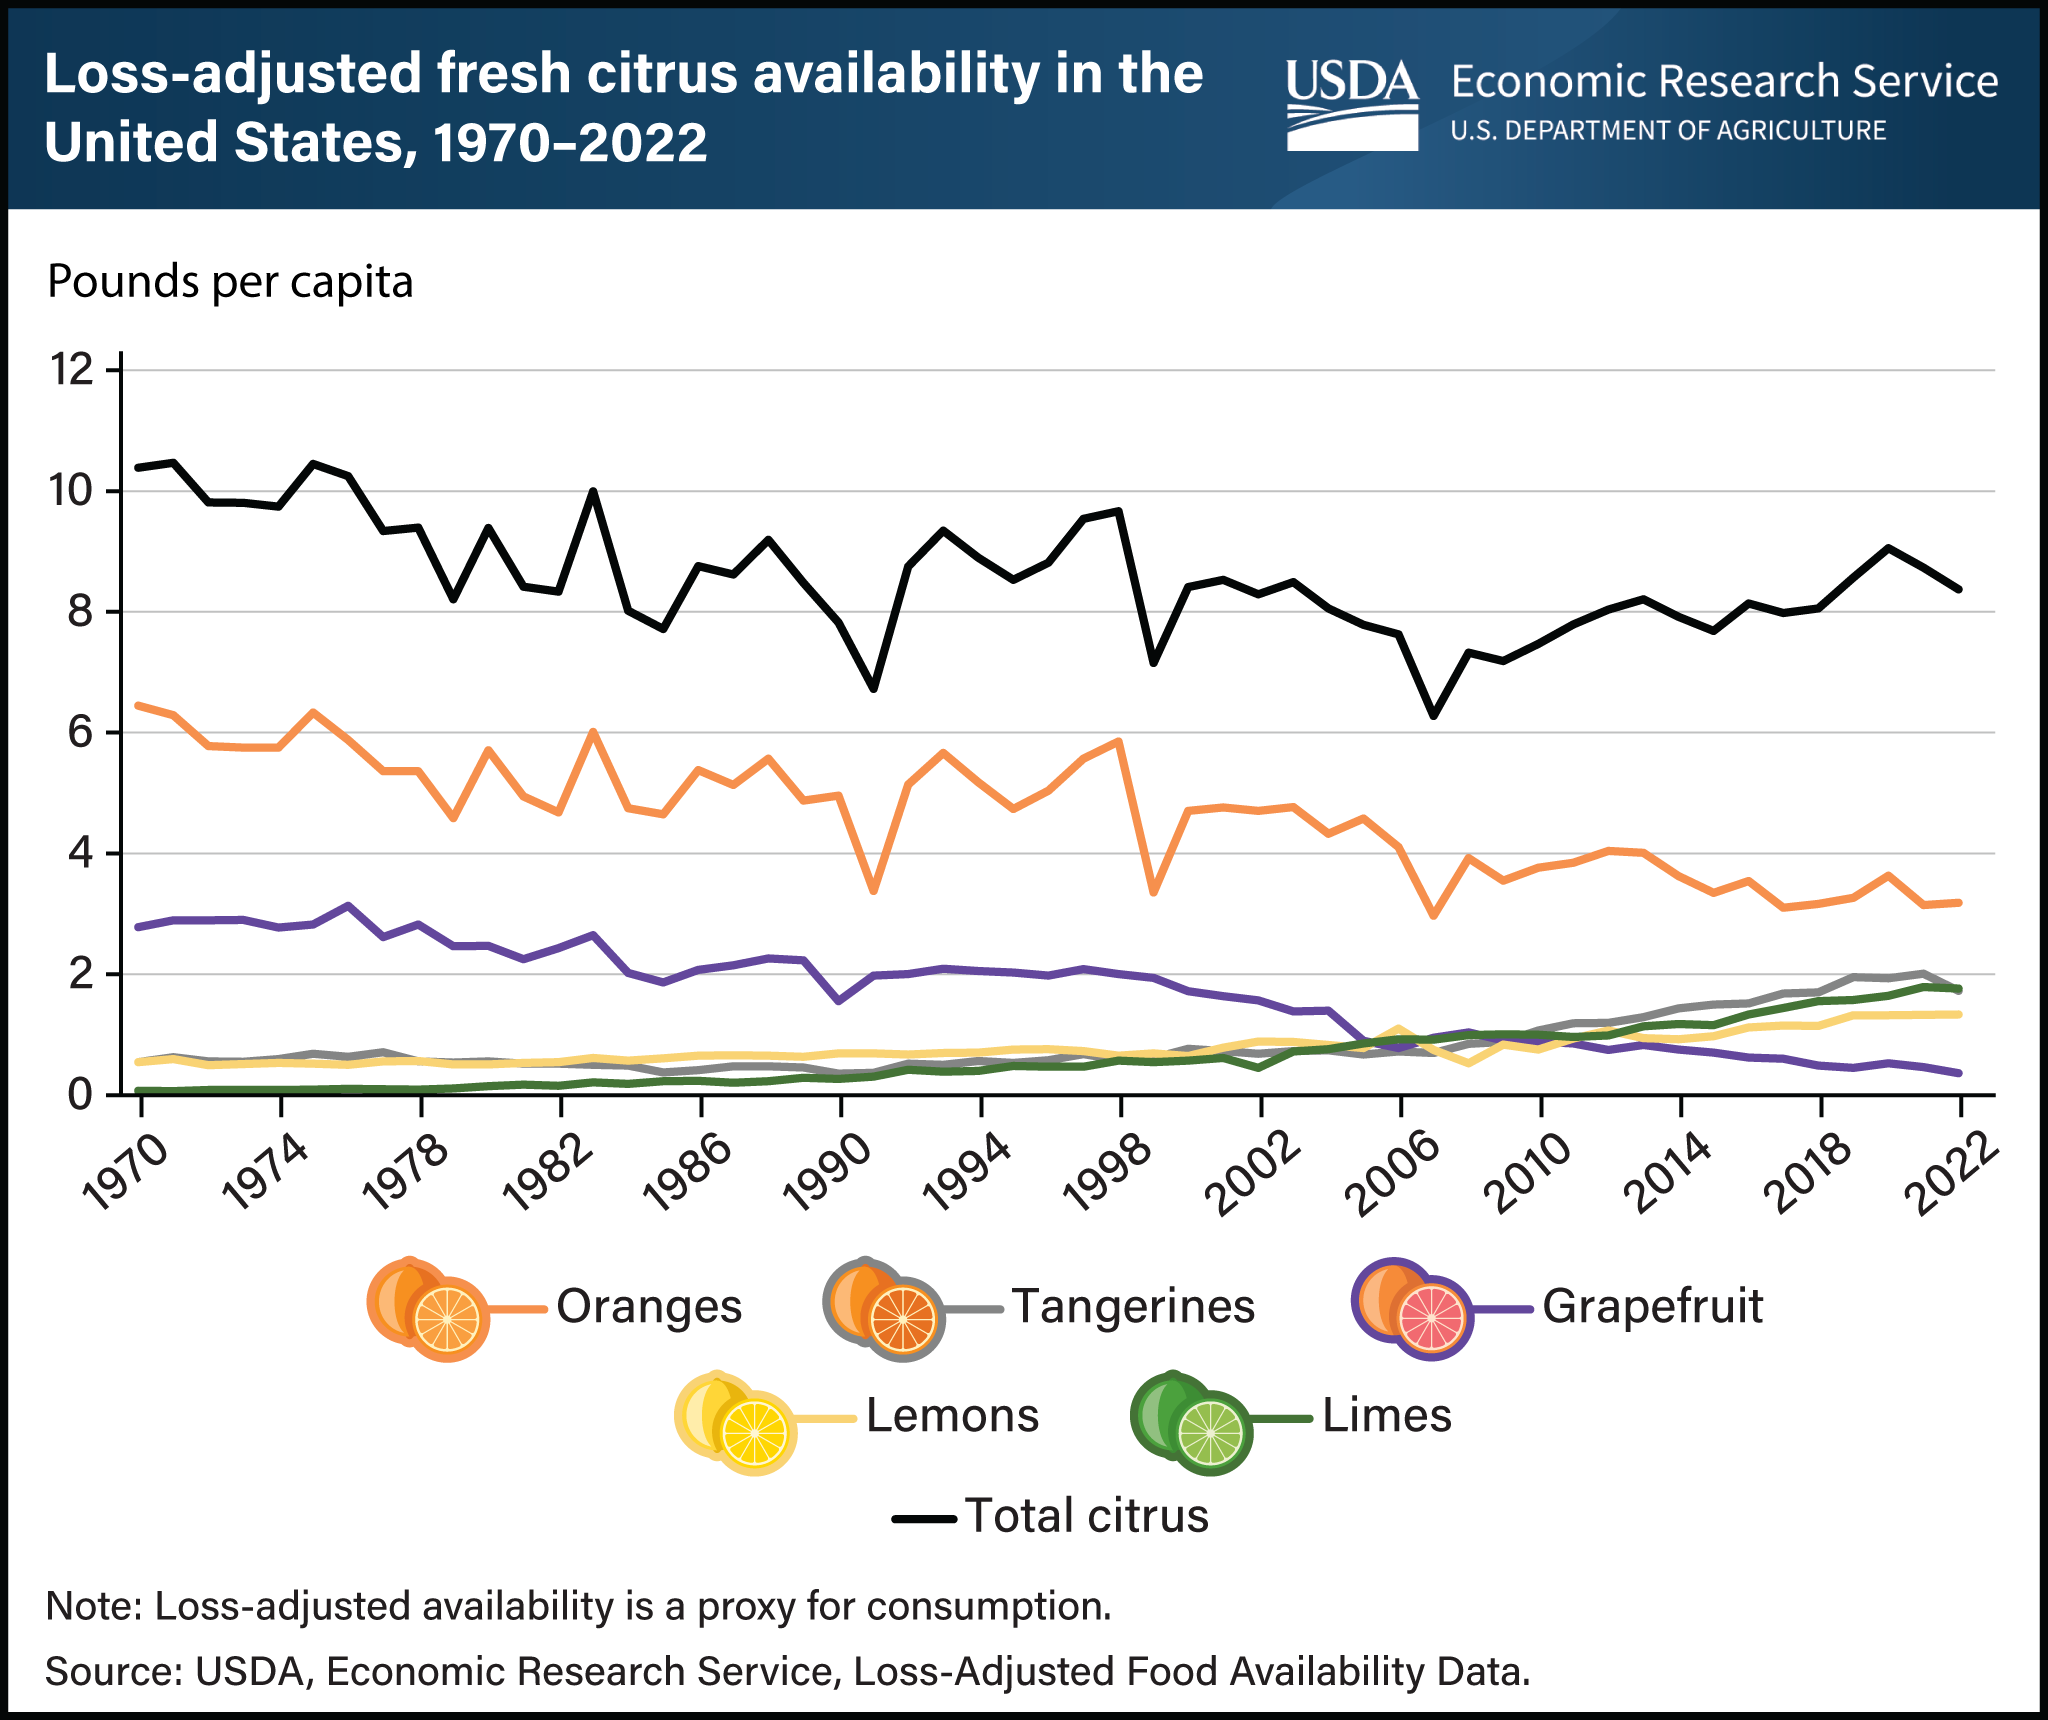
In 2022, the total supply of fresh citrus fruits available for consumption in the United States was nearly 8.4 pounds per person after adjusting for spoilage, plate waste, and other losses. From 1970 to 2022, loss-adjusted per person availability of oranges and grapefruit fell by nearly 51 and 87 percent, respectively. Meanwhile, availability of other citrus fruits grew: Lemons doubled, while limes increased by nearly 24 times. Year-to-year changes in availability of citrus fruits reflect swings in production caused by weather events, citrus diseases, changes in import or export volumes, and other factors. Longer trends, however, are usually driven by changes in consumer demand. For example, skipping breakfast—or making it a “grab-and-go” meal—is likely to reduce demand for fresh oranges and grapefruit. Grapefruit takes more effort to eat, especially when compared with easy-to-peel citrus fruits such as tangerines, which are sweeter and smaller. This chart uses loss-adjusted data from USDA, Economic Research Service’s Food Availability (Per Capita) Data System (FADS), April 2023.
We’d welcome your feedback!
Would you be willing to answer a few quick questions about your experience?