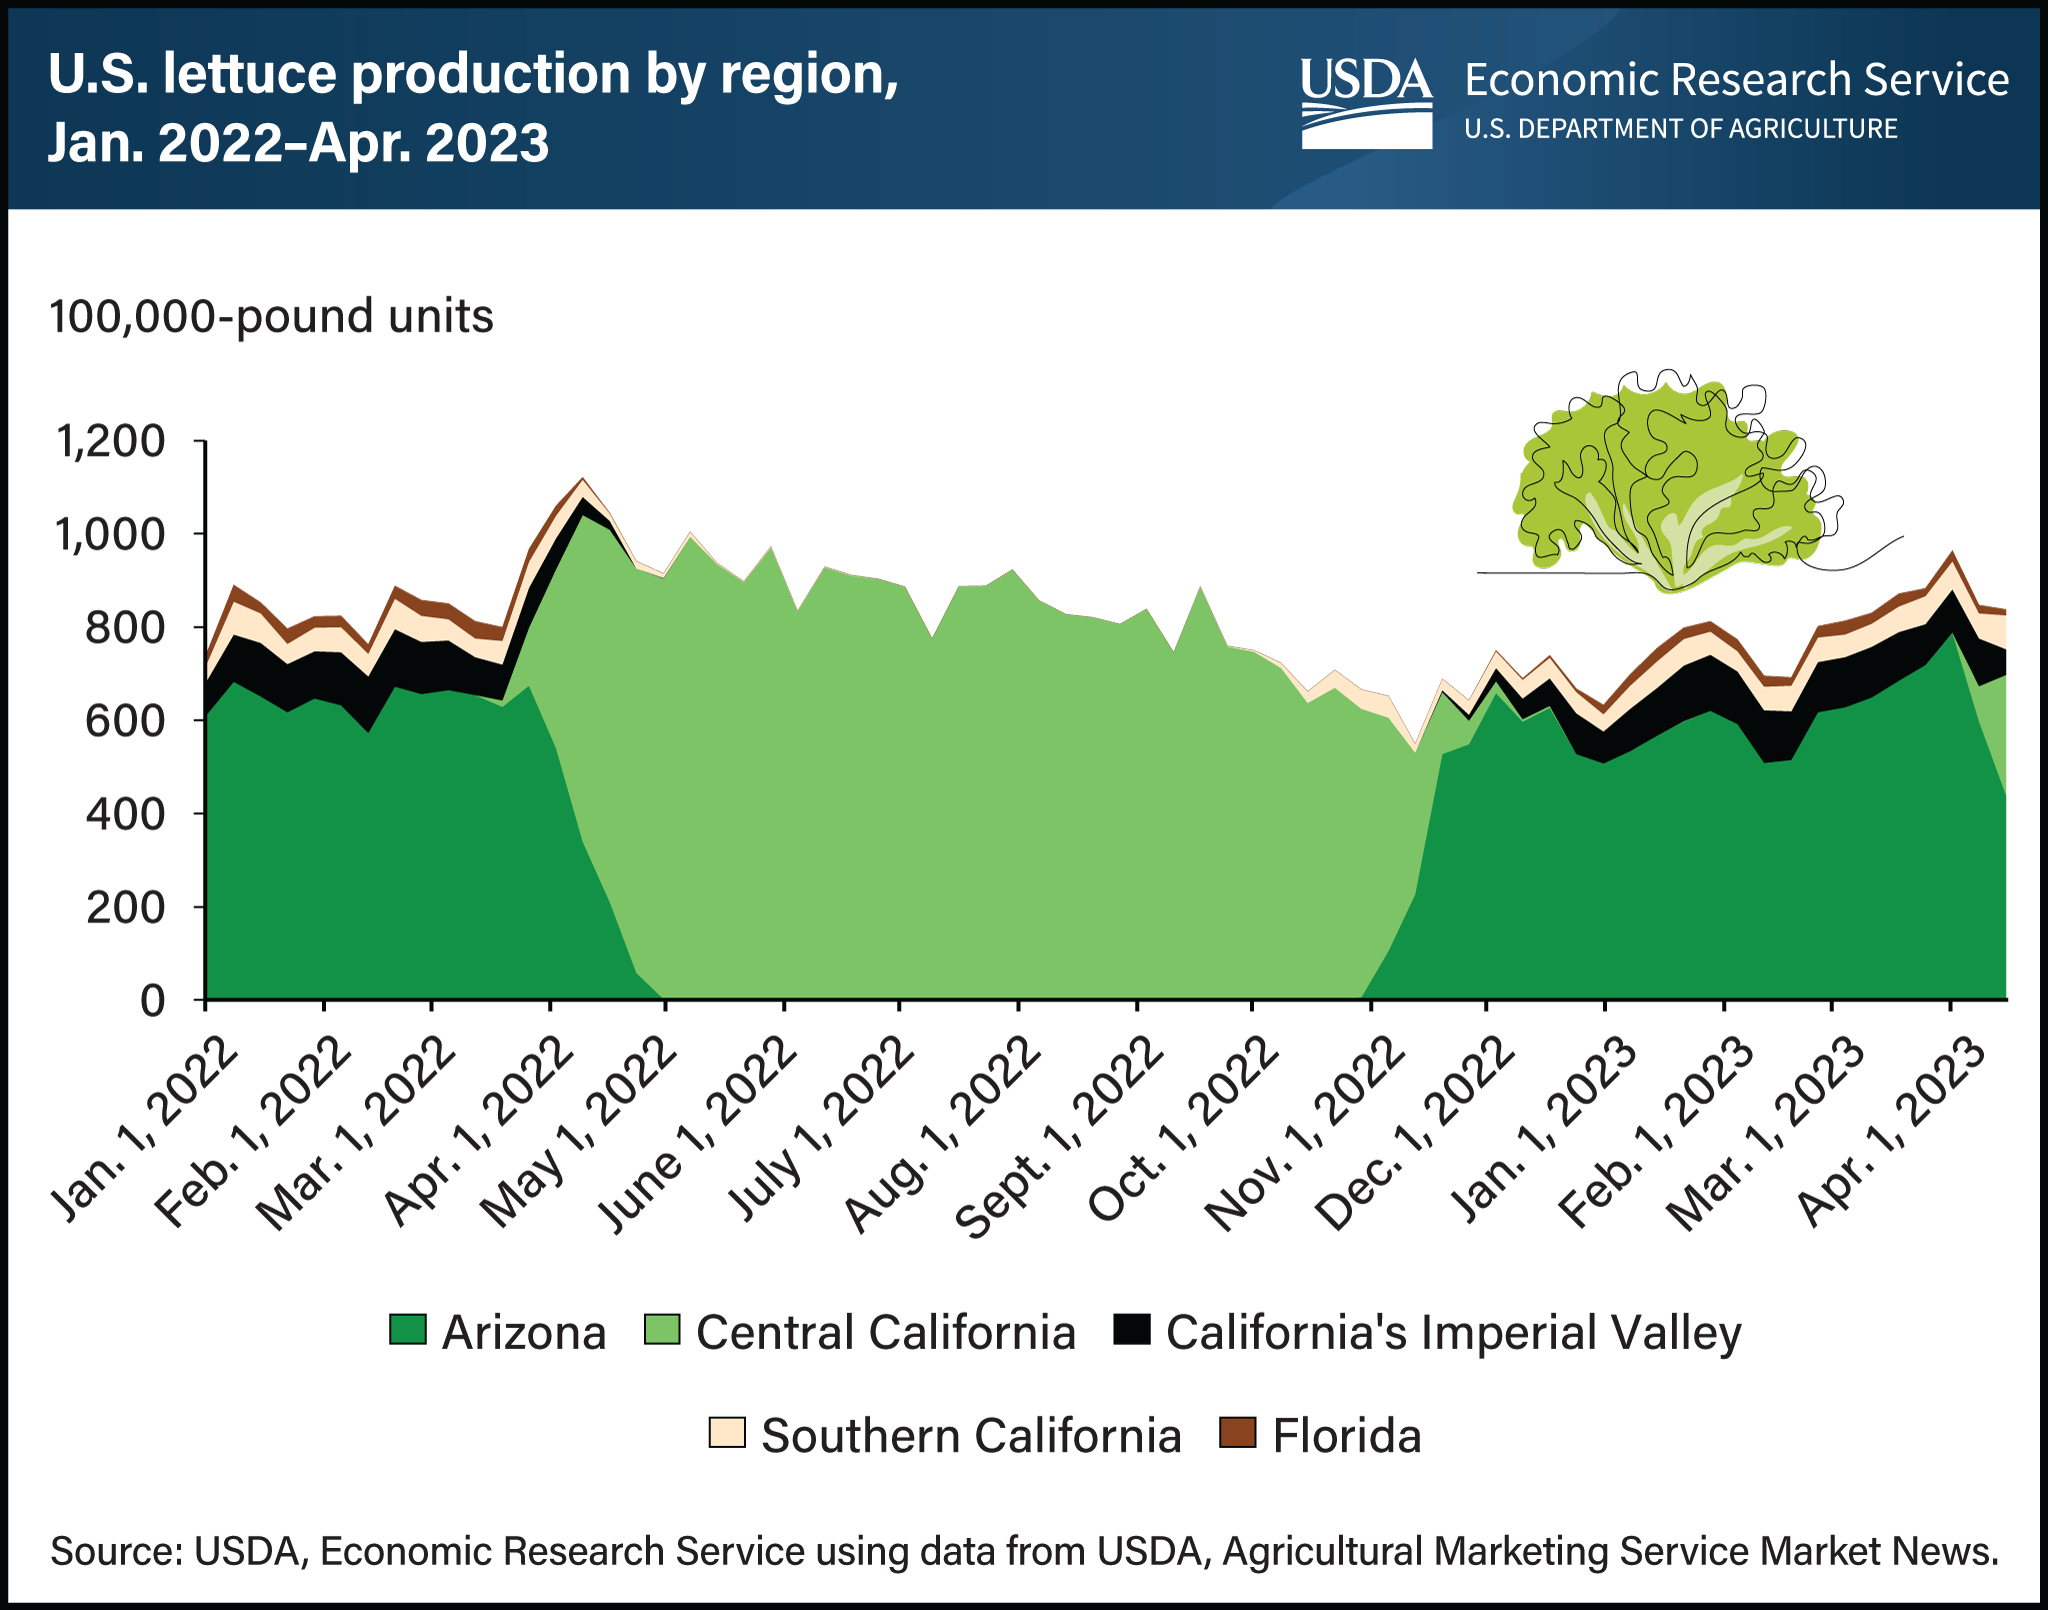
U.S. lettuce production shifts regionally by season
- by Catharine Weber
- 5/18/2023

Lettuce—the main ingredient in many salads and a popular sandwich topper—is the most widely consumed leafy green in the United States. In 2022, lettuce accounted for nearly one-fifth of the $21.8 billion that U.S. growers received in cash receipts from sales of vegetables and melons. Romaine lettuce sales totaled $1.54 billion, iceberg lettuce sales were $1.33 billion, and leaf lettuce sales trailed at $1.25 billion. An estimated 85 percent of the lettuce available for consumption in the United States was produced domestically in 2022. While production of lettuce occurs year-round, areas of production shift with the growing seasons. From mid-November through early April, most lettuce sold in the United States is sourced from the irrigated desert valleys of Southern California’s Imperial County and the Yuma area of Arizona. Shipments of lettuce from Florida help fill in regional market gaps during winter and spring months. From late April through mid-November, production shifts to Central California. From spring through fall, local production in most other States serves farmers markets, regional/local retail and restaurant demand, and community-supported agriculture. This chart is drawn from an article titled, “Lettuce Trends: Conventional, Organic Growth, and Production,” from USDA, Economic Research Service’s Vegetables and Pulses Outlook, April 2023.

