
Manure sources vary for crops based on proximity to livestock production
- by Nigel Key and Laura Dodson
- 4/11/2023
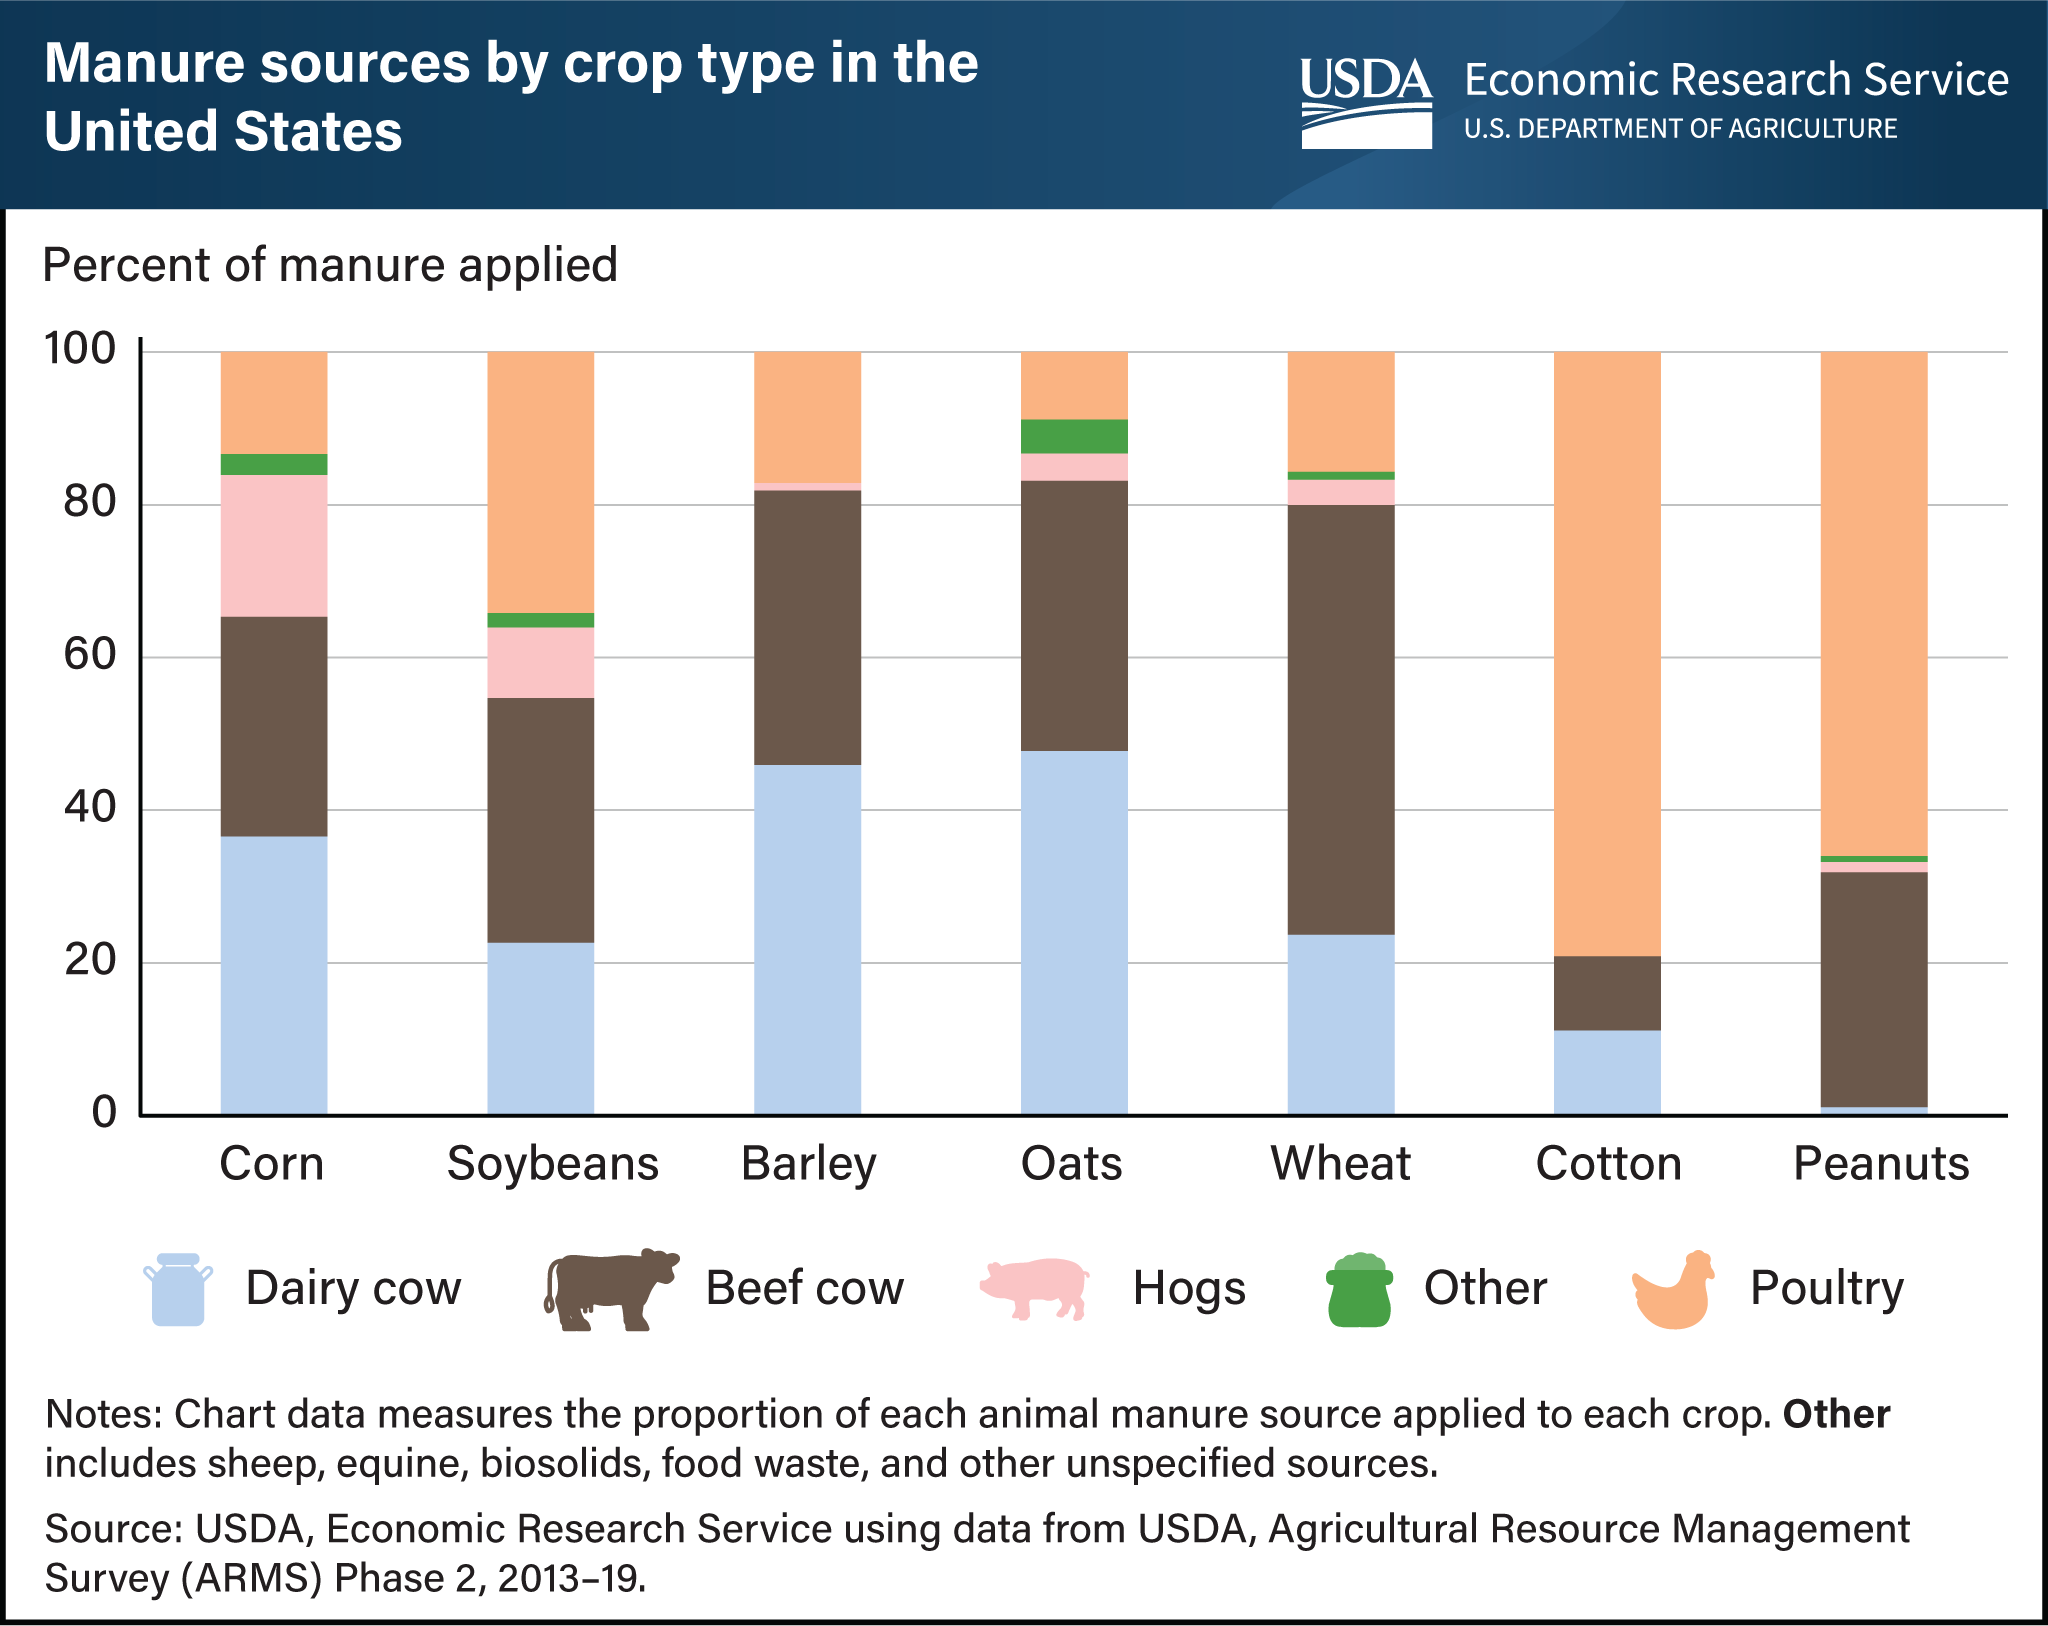
The proximity of livestock production helps explain the type of manure farmers apply to crops. Livestock production is geographically concentrated in the United States, and manure can be expensive to transport because of its low nutrient density and high proportion of water. Accordingly, farmers typically apply the type of manure that is available from local animal production. Since most hogs are produced in the Midwest, hog manure is applied more often to corn and soybeans that are grown in the region. Dairies, which tend to be located in the western, midwestern, and northeastern U.S., supply the largest share of manure applied to corn, barley, and oats. Most chickens are raised in the southeastern U.S. and poultry manure is used to meet crop nutrient needs of cotton and peanuts that are mainly grown in the region. Beef cattle operations in the Great Plains supply more than 50 percent of the manure applied to wheat acreage. In 2020, manure was applied to about 8 percent of the 240.9 million acres planted to seven major U.S. field crops. This chart appears in the USDA, Economic Research Service report Increasing the Value of Animal Manure for Farmers, published March 2023.