Domestic migration patterns foster strong ties between many nonmetro and metro areas
- by John Cromartie and Peter B. Nelson
- 1/4/2023

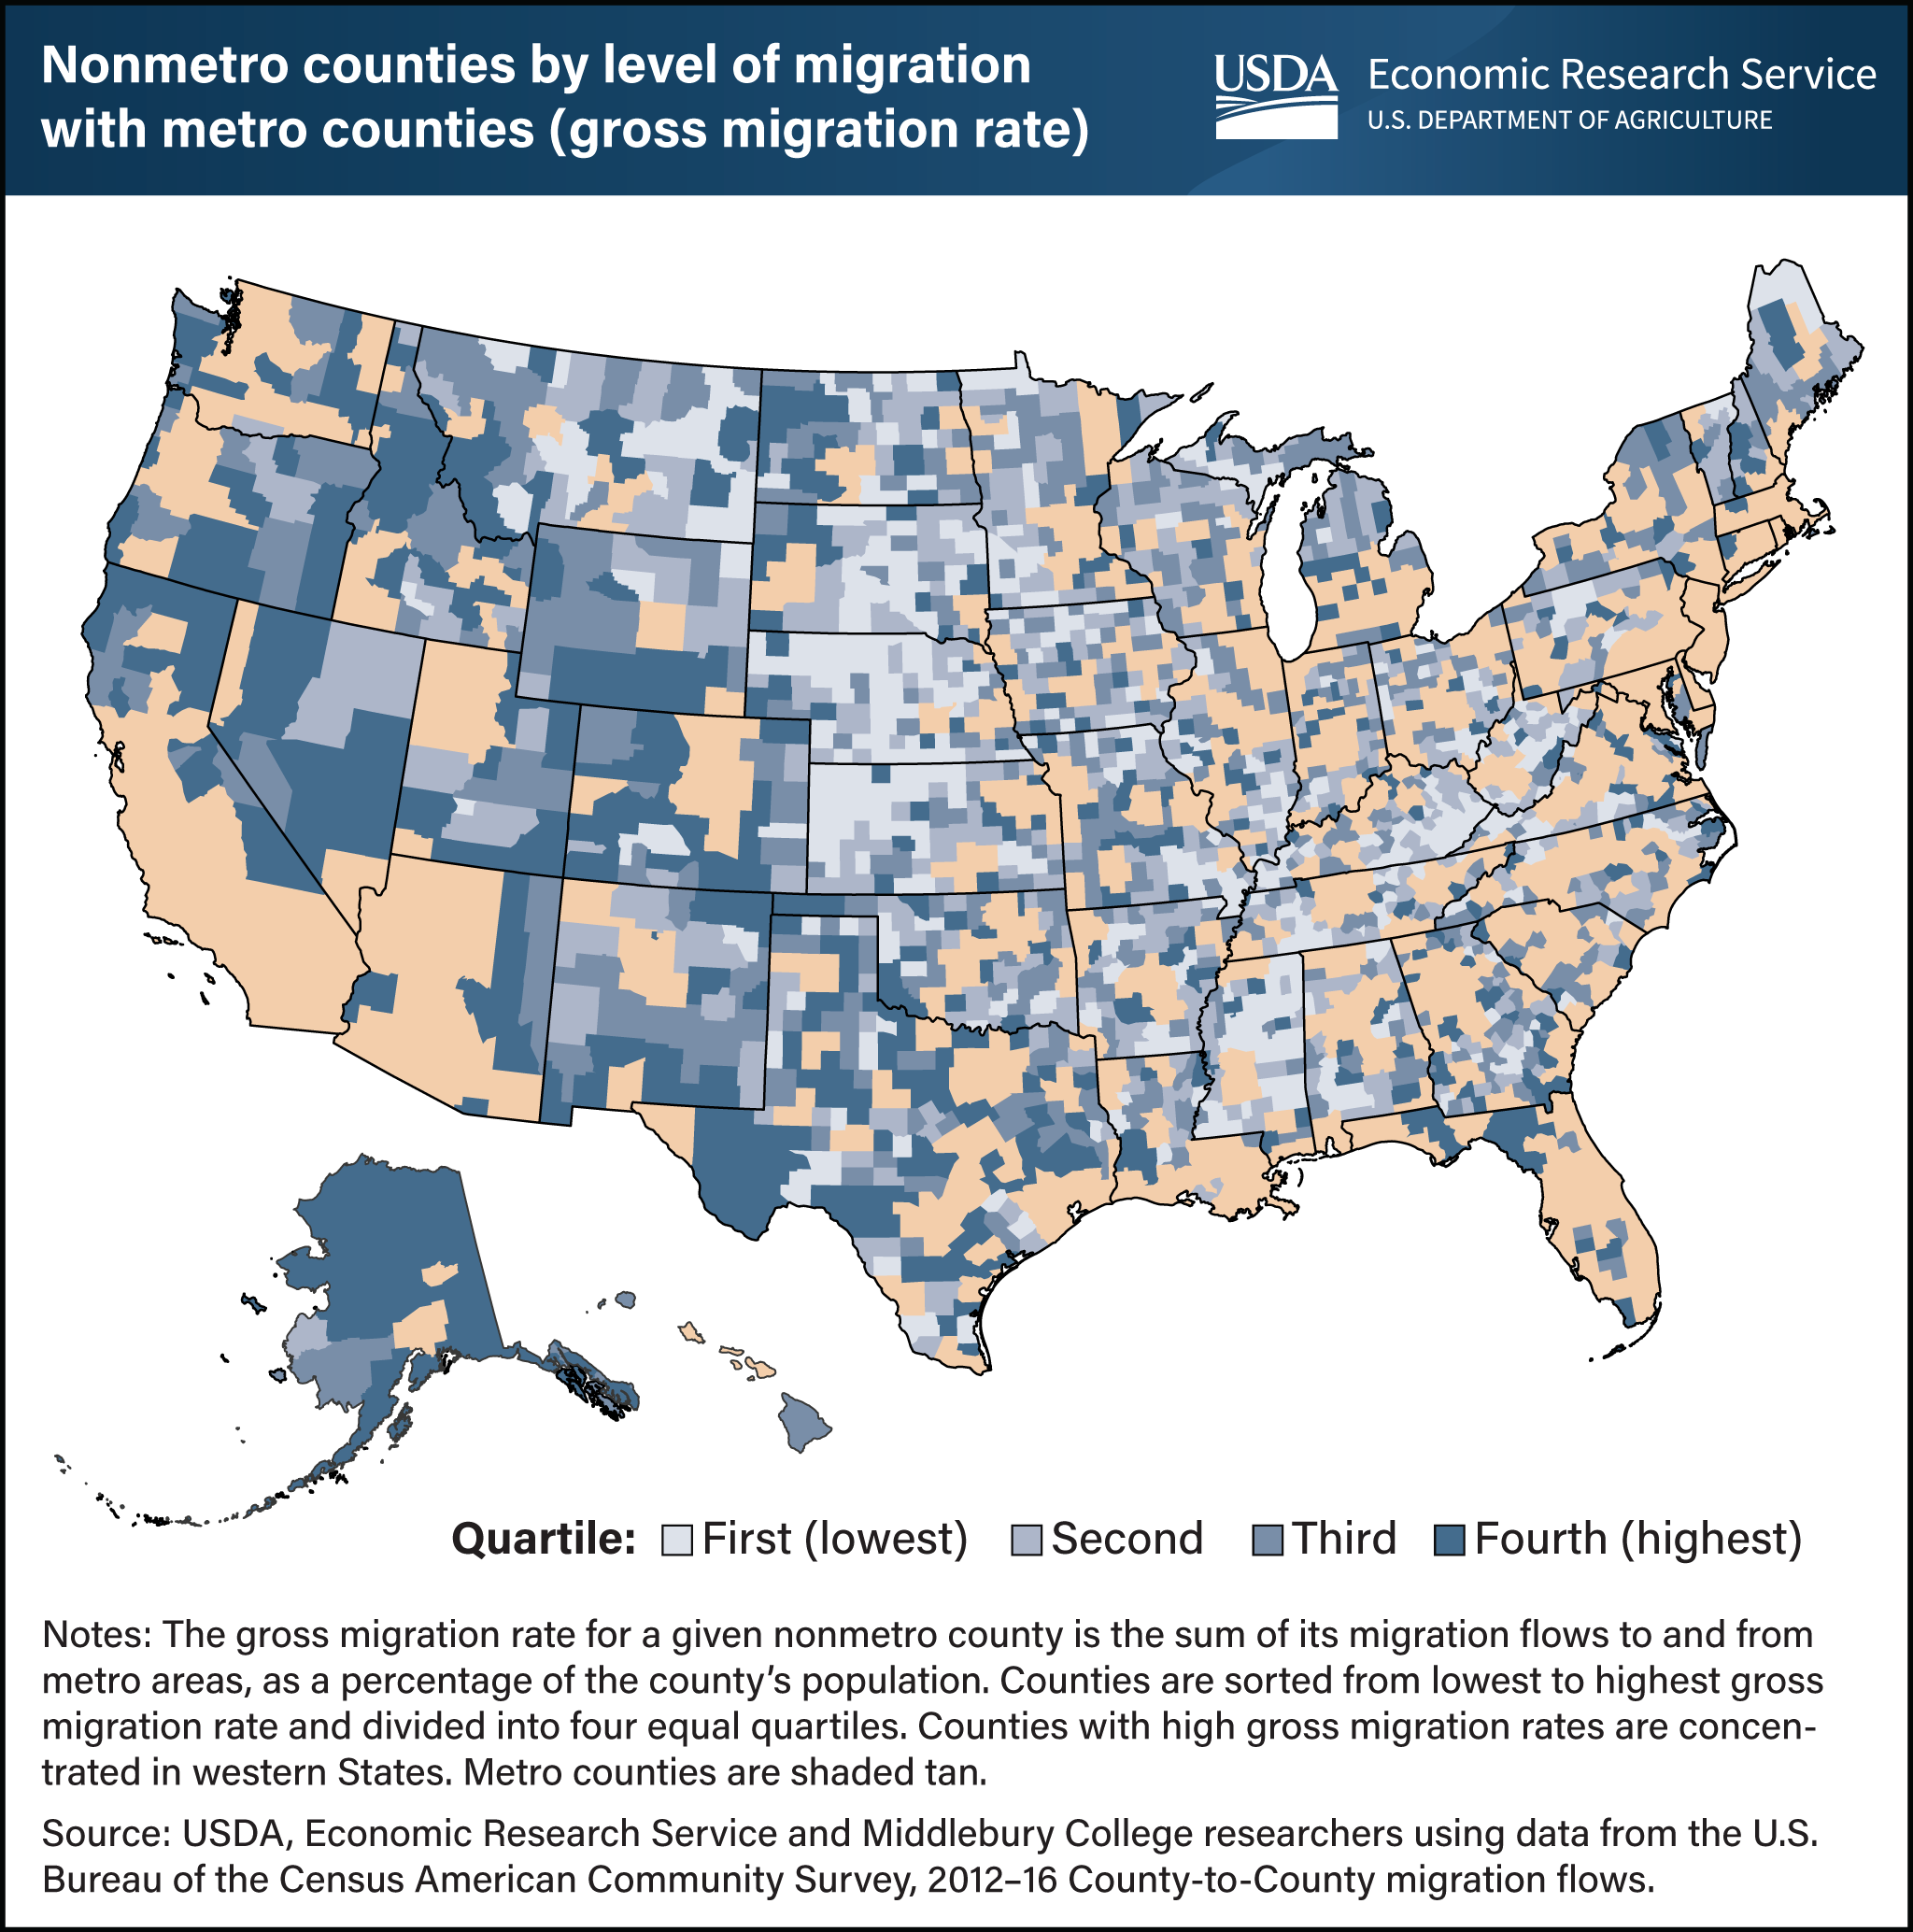
Human movements between places vary considerably across space, so their contribution to the spread of COVID-19 also varied spatially. For instance, some rural communities have long histories as recreation or tourist destinations and more established migration connections to larger cities. In examining county-to-county migration patterns, researchers organized nonmetropolitan (nonmetro) counties into four equal groups, or quartiles, based on the rate at which people moved to or from metropolitan (metro) counties. The counties in the lowest quartile (lightest blue on the map) have the weakest migration connections with metro regions, meaning few people move back and forth proportionately. Remote counties far from any metro region, such as in the central and northern Great Plains, fall in the lowest quartile. Those counties in the fourth quartile (darkest blue) have the strongest migration connectivity and are typically adjacent to metro centers, such as southern New Hampshire, along the Front Range in Colorado, and in parts of Texas adjacent to Houston, Dallas-Fort Worth, and San Antonio. However, some very remote areas have high migration ties to metro counties, such as areas of Wyoming, Idaho, and North Dakota. These are places that have unique economic conditions that tie them to urban areas. Western North Dakota had a burgeoning energy sector from 2012 to 2016 (when these migration flows were measured), and there are established amenity destinations in the Colorado Rockies; Sun Valley, Idaho; Jackson, Wyoming; and along the Washington and Oregon coasts. Nonmetro counties with higher migration connectivity to metro areas were more likely to experience outbreaks of COVID-19 during the first few weeks and months of the pandemic compared with less-connected nonmetro counties. This chart appears in the USDA, Economic Research Service report COVID-19 Working Paper: Migration, Local Mobility, and the Spread of COVID-19 in Rural America, published in November 2022.

