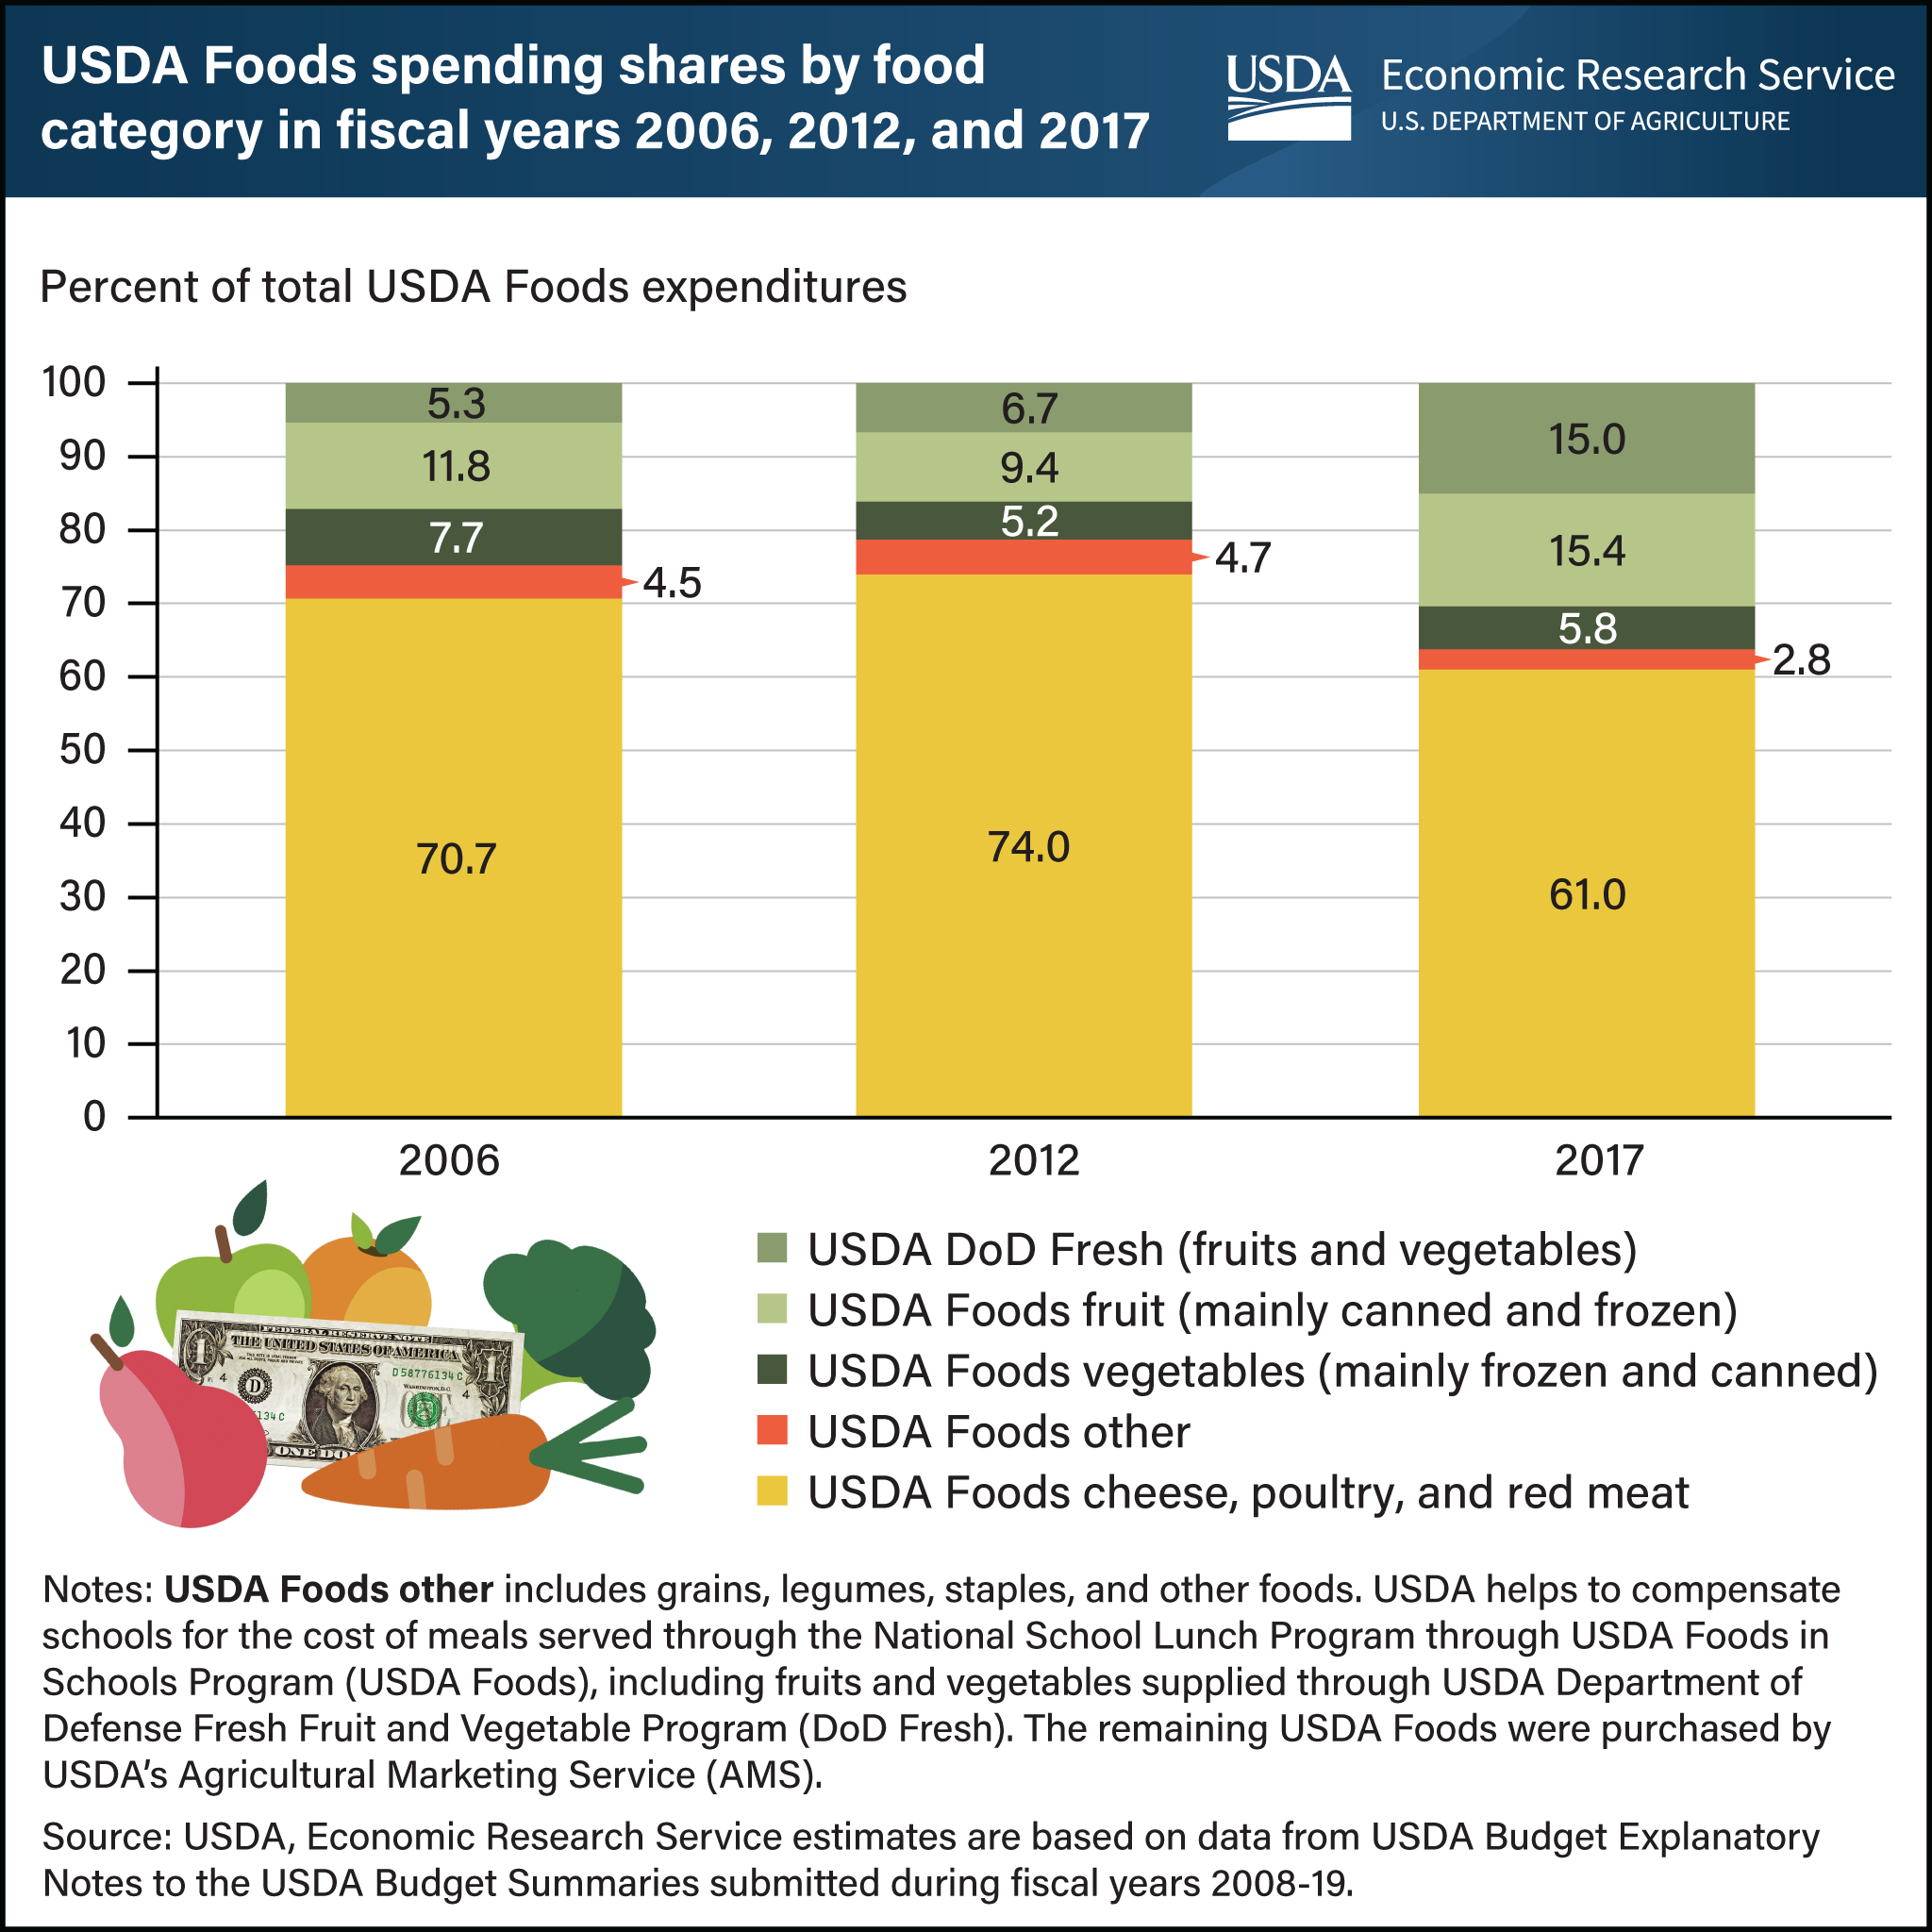
Schools obtained more fruits and vegetables through USDA Foods after school meal nutrition standards were updated in 2012
- by Michael Ollinger and Joanne Guthrie
- 10/24/2022

About 100,000 U.S. public and private nonprofit schools participate in the National School Lunch Program (NSLP), which served about 4.9 billion lunches in fiscal year 2019. The majority of foods served through the NSLP are bought through typical market channels, such as foodservice distributors, with USDA cash reimbursements to schools supporting their purchase. However, schools also make use of the USDA Foods in Schools Program (USDA Foods). Schools have two options for acquiring fruits and vegetables through USDA Foods: USDA Foods purchased by USDA’s Agricultural Marketing Service (AMS), which supplies mainly canned and frozen fruits and vegetables, and fresh fruits and vegetables distributed through the USDA Department of Defense Fresh Fruit and Vegetable Program (DoD Fresh). After school meal nutrition standards were updated in 2012, schools were required to serve more fruits and a wider mix of vegetables, including dark green and red/orange vegetables. Following the change in standards, schools obtained more fruits and vegetables through USDA Foods and especially through DoD Fresh. While there was no clear change in the types of foods chosen from 2006 to 2012, the percent of USDA Foods entitlement funds used for purchasing fruits and vegetables from DoD Fresh rose sharply from 6.7 percent of total USDA Foods in 2012 to 15 percent in 2017. Fruit obtained through AMS—mainly canned and frozen—rose from 9.4 percent of total USDA Foods spending in 2012 to 15.4 percent in 2017. Vegetables obtained from USDA’s AMS slightly rose from 2012 to 2017. As the percentage of spending on fruits and vegetables increased, the percentage spent on meat, poultry, and cheese dropped from nearly 74 percent in 2012 to 61 percent in 2017. This chart appears in the ERS report, Trends in USDA Foods Ordered for Child Nutrition Programs Before and After Updated Nutrition Standards, released September 1, 2022.
We’d welcome your feedback!
Would you be willing to answer a few quick questions about your experience?

