
Federal spending on food assistance reached record high of $182.5 billion in 2021
- by Jordan W. Jones, Saied Toossi and Leslie Hodges
- 6/23/2022
USDA, Economic Research Service (ERS) released “The Food and Nutrition Assistance Landscape: Fiscal Year 2021 Annual Report” on Wednesday, June 22. The report examines program trends and policy changes in USDA’s largest U.S. food and nutrition assistance programs through fiscal year 2021. An overview of the annual ERS report will be provided in a webinar at 1 p.m. EDT, Thursday, June 23. To join or register, click here.
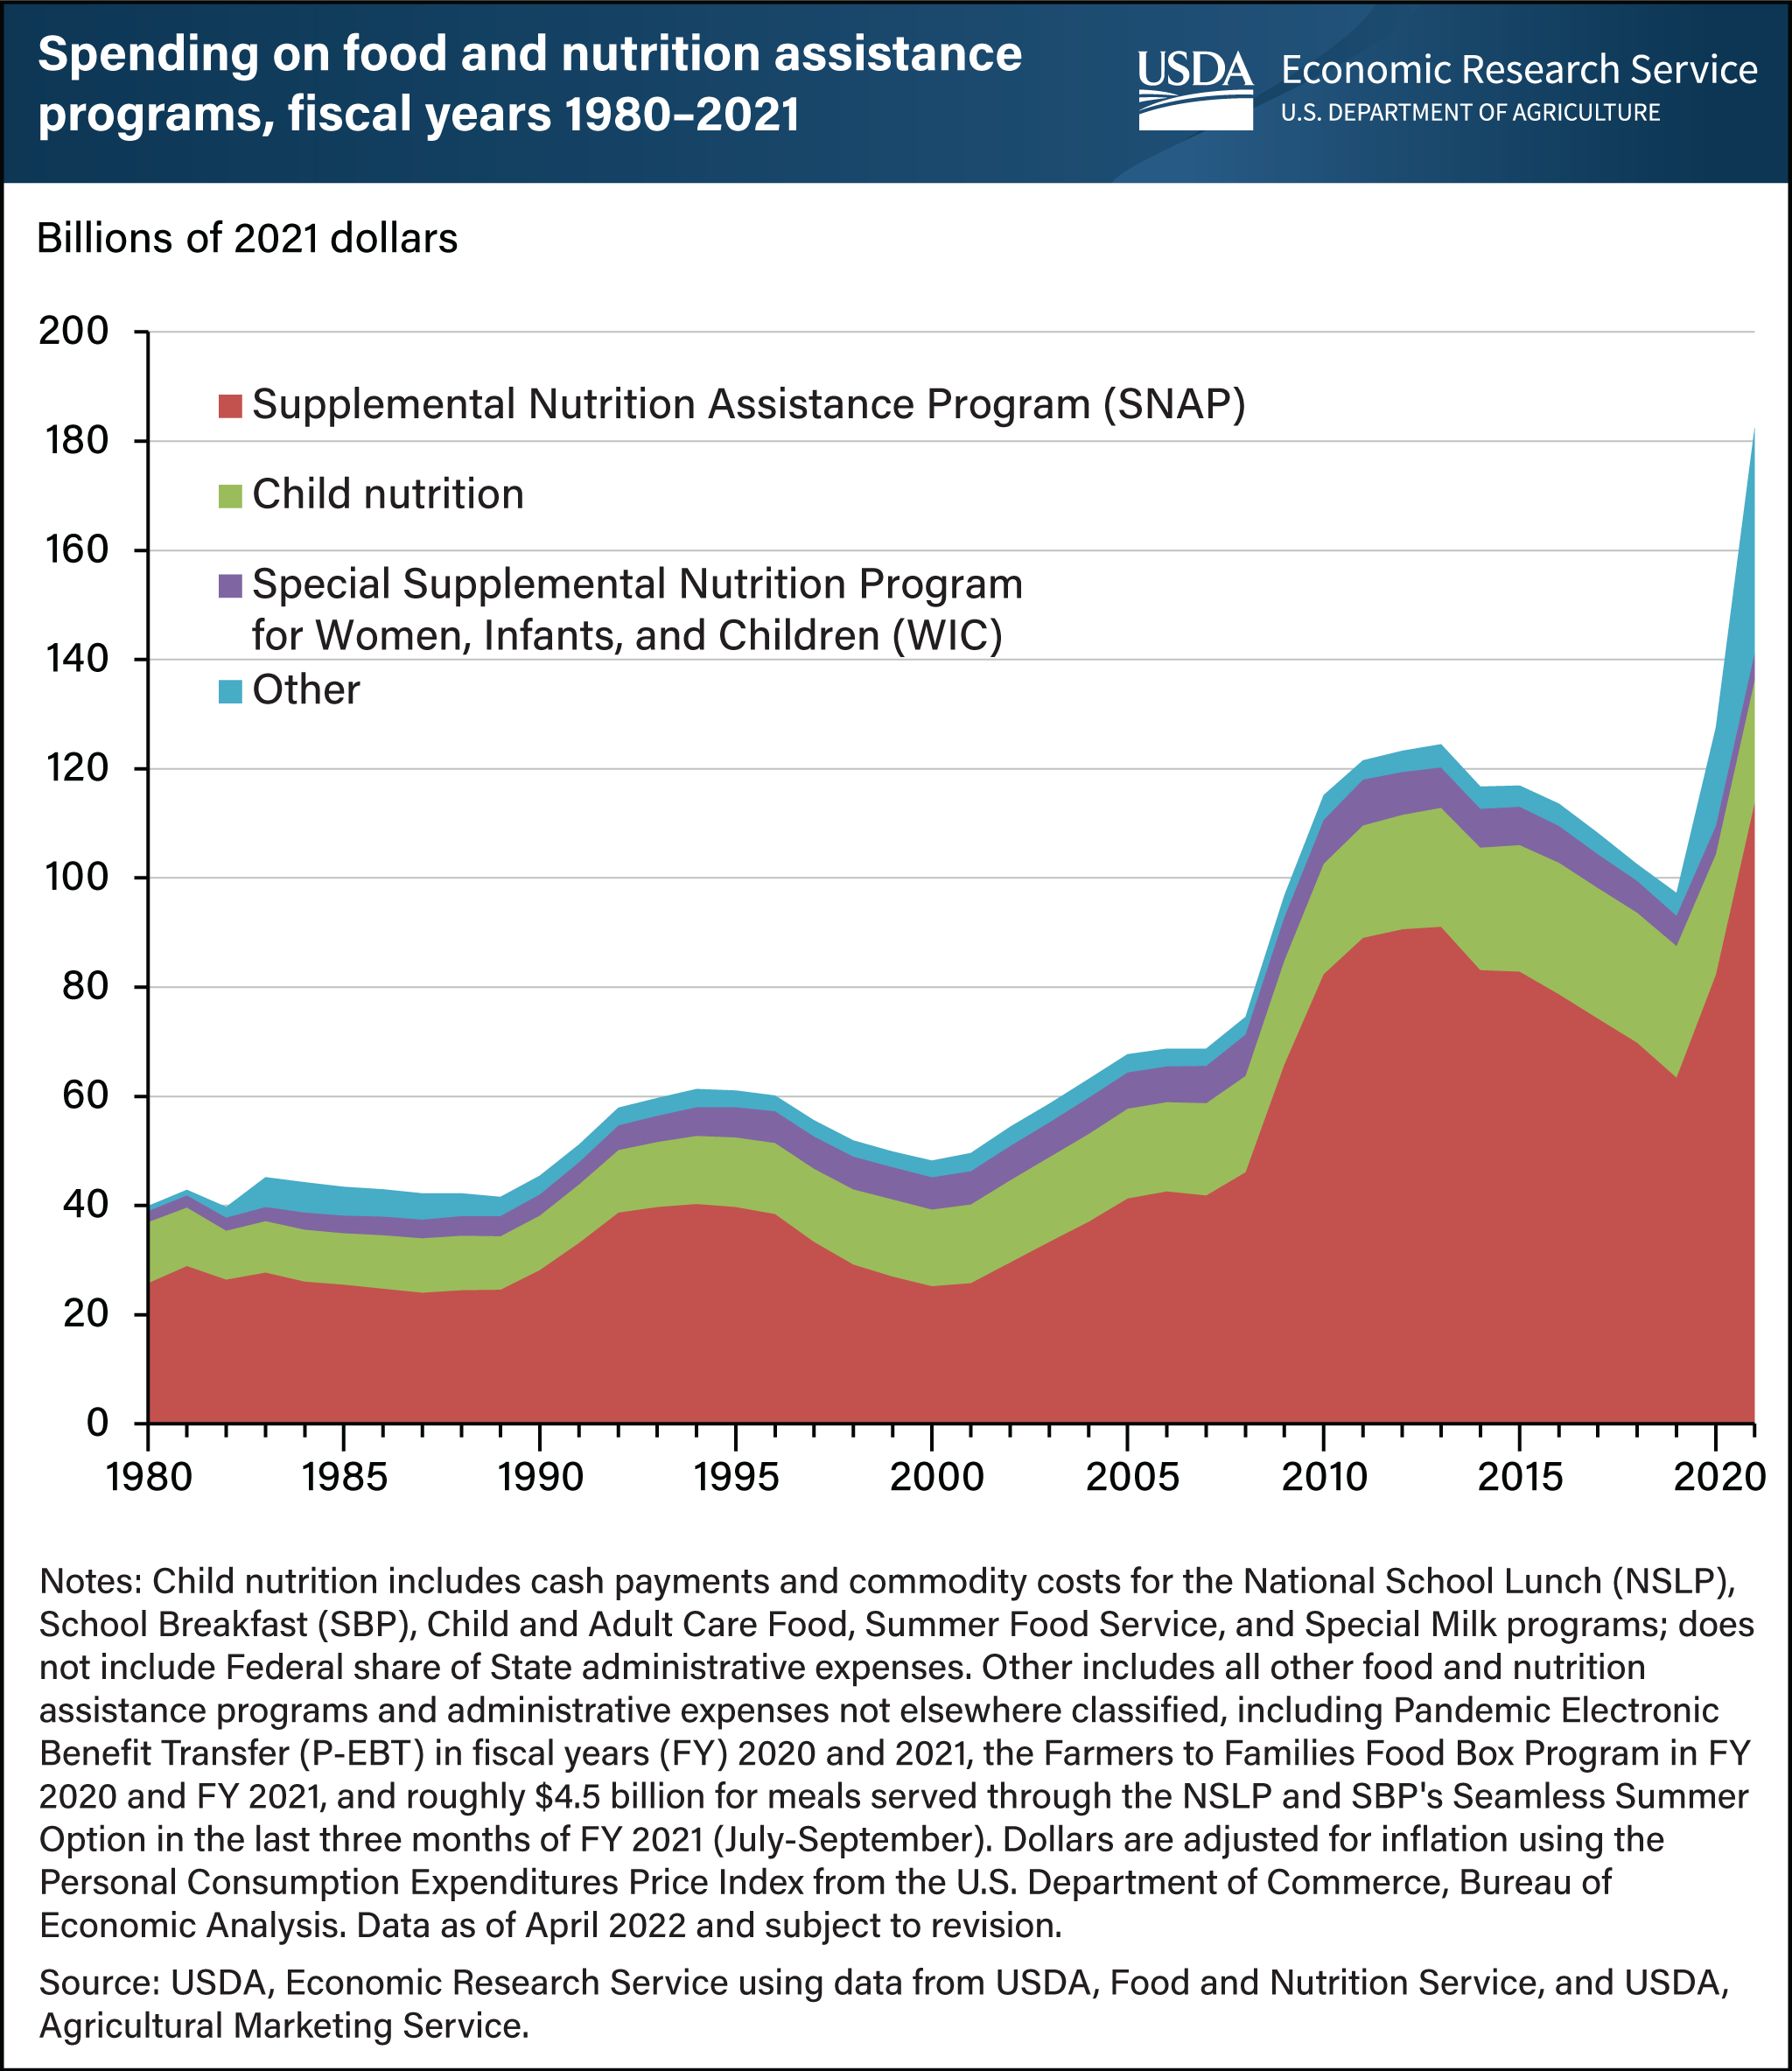
Spending on USDA’s food and nutrition assistance programs jumped 43 percent in fiscal year (FY) 2021 to an inflation-adjusted record high of $182.5 billion. This increase reflected the heightened need for food assistance during the Coronavirus (COVID-19) pandemic and the subsequent Federal response. In FY 2021, USDA expanded program benefits, approved waivers allowing flexibility in the administration of existing food and nutrition assistance programs, and continued to operate two temporary programs, Pandemic Electronic Benefit Transfer (P-EBT) and the Farmers to Families Food Box Program (Food Box Program). P-EBT and the Supplemental Nutrition Assistance Program (SNAP) experienced the largest increases in spending from FY 2020, 162 percent and 44 percent, respectively. These increases reflect P-EBT’s operation throughout all of FY 2021 (compared with only part of FY 2020) and the issuance of SNAP emergency allotments, which temporarily raised all recipients’ benefits up to or above the maximum benefit for their household size. Combined spending on the four largest child nutrition programs (the National School Lunch Program, School Breakfast Program, Child and Adult Care Food Program, and Summer Food Service Program) increased, as did spending on both the Food Box Program and the Special Supplemental Nutrition Program for Women, Infants, and Children (WIC). This chart is based on data available as of April 2022 that are subject to revision and a chart appearing in the USDA, Economic Research Service’s Food and Nutrition Assistance Landscape: Fiscal Year 2021 Annual Report, released June 22, 2022.