
Texas carves new position leading the United States in pumpkin revenues
- by Gregory Astill
- 10/25/2021
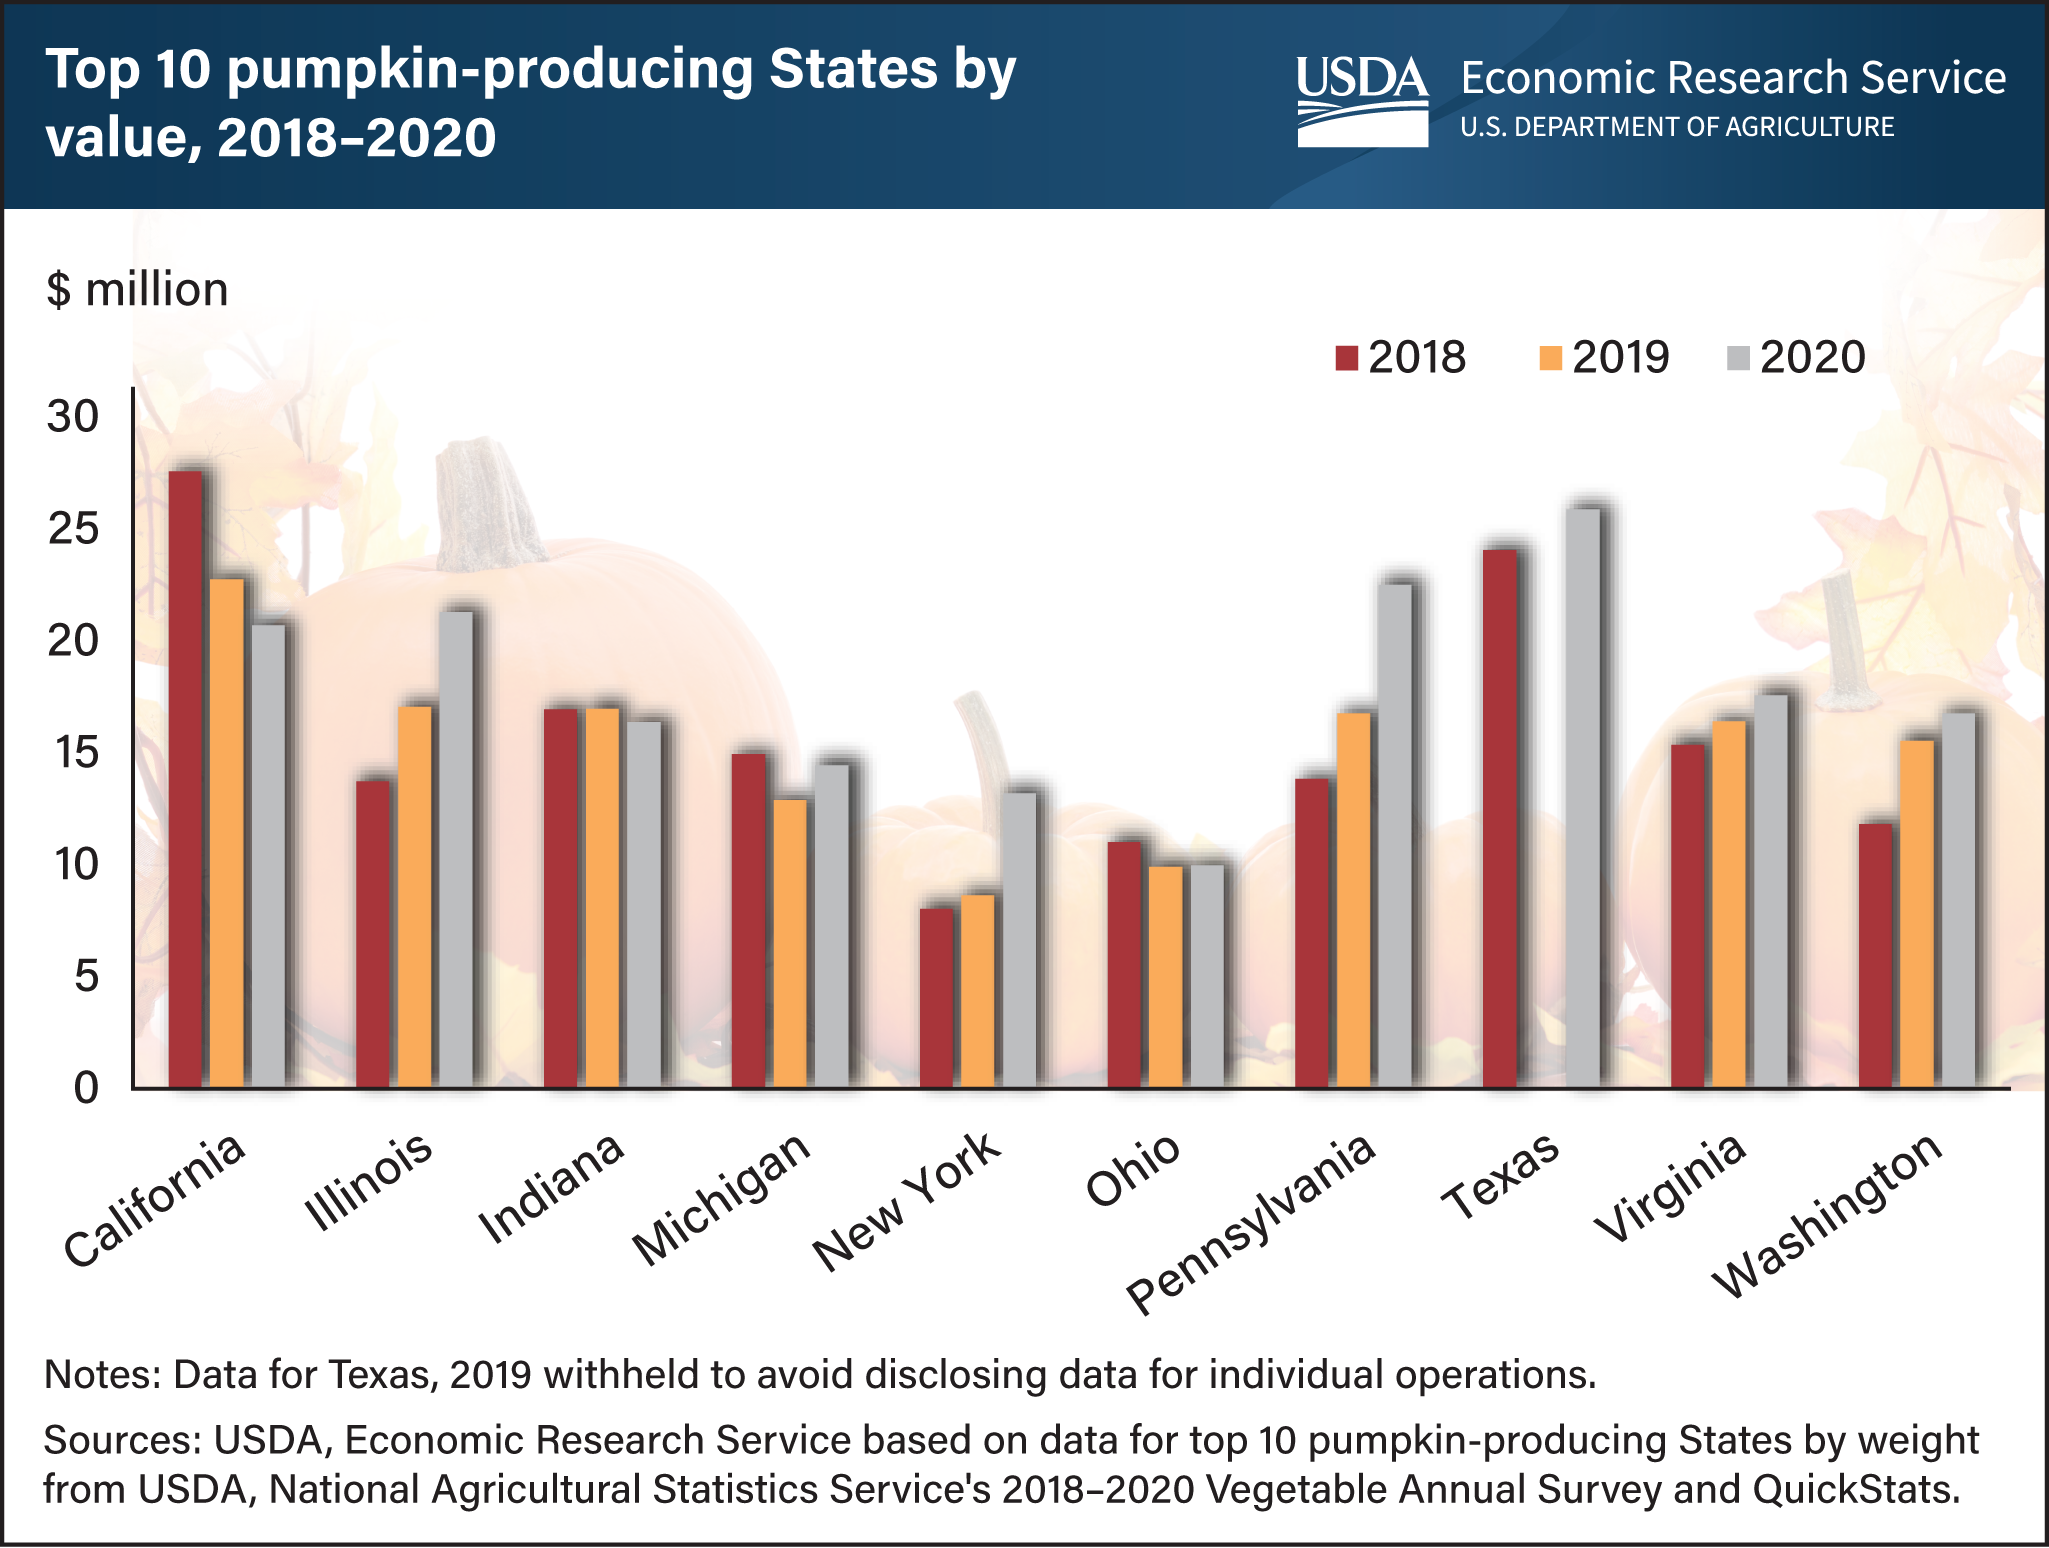
Pumpkins are a staple of fall traditions for many Americans who pick them, carve them into jack-o’-lanterns, or bake pumpkin desserts. Although pumpkins are grown in many States, most of the production comes from only 10 States. By acreage and by weight, Illinois is consistently the Nation’s largest pumpkin producer. However, unlike other States, most of Illinois’ pumpkins are used for pie filling and other processed foods, which receive a lower price per pound than ornamental jack-o’-lantern-style pumpkins. Production value of pumpkins in Illinois was ranked third in 2020 at $21.3 million. In 2020, Texas led the Nation in the value of pumpkins produced at $25.9 million, followed by Pennsylvania at $22.5 million, Illinois, and California at $20.7 million. Dry weather in Texas led to higher quality and lower yields, contributing to prices that exceeded those received by growers in any other State in 2020. Retail prices for pumpkins typically fluctuate week to week leading up to Halloween. In the second week of October 2021, the average retail price for jack-o’-lantern-style pumpkins was $4.09 per pumpkin, up 12 percent compared with the same week in 2020. This chart is drawn from Economic Research Service’s Trending Topics page, Pumpkins: Background & Statistics.