
U.S. farm profit projections remain mixed through 2030
- by Dipak Subedi and Erik Dohlman
- 5/14/2021
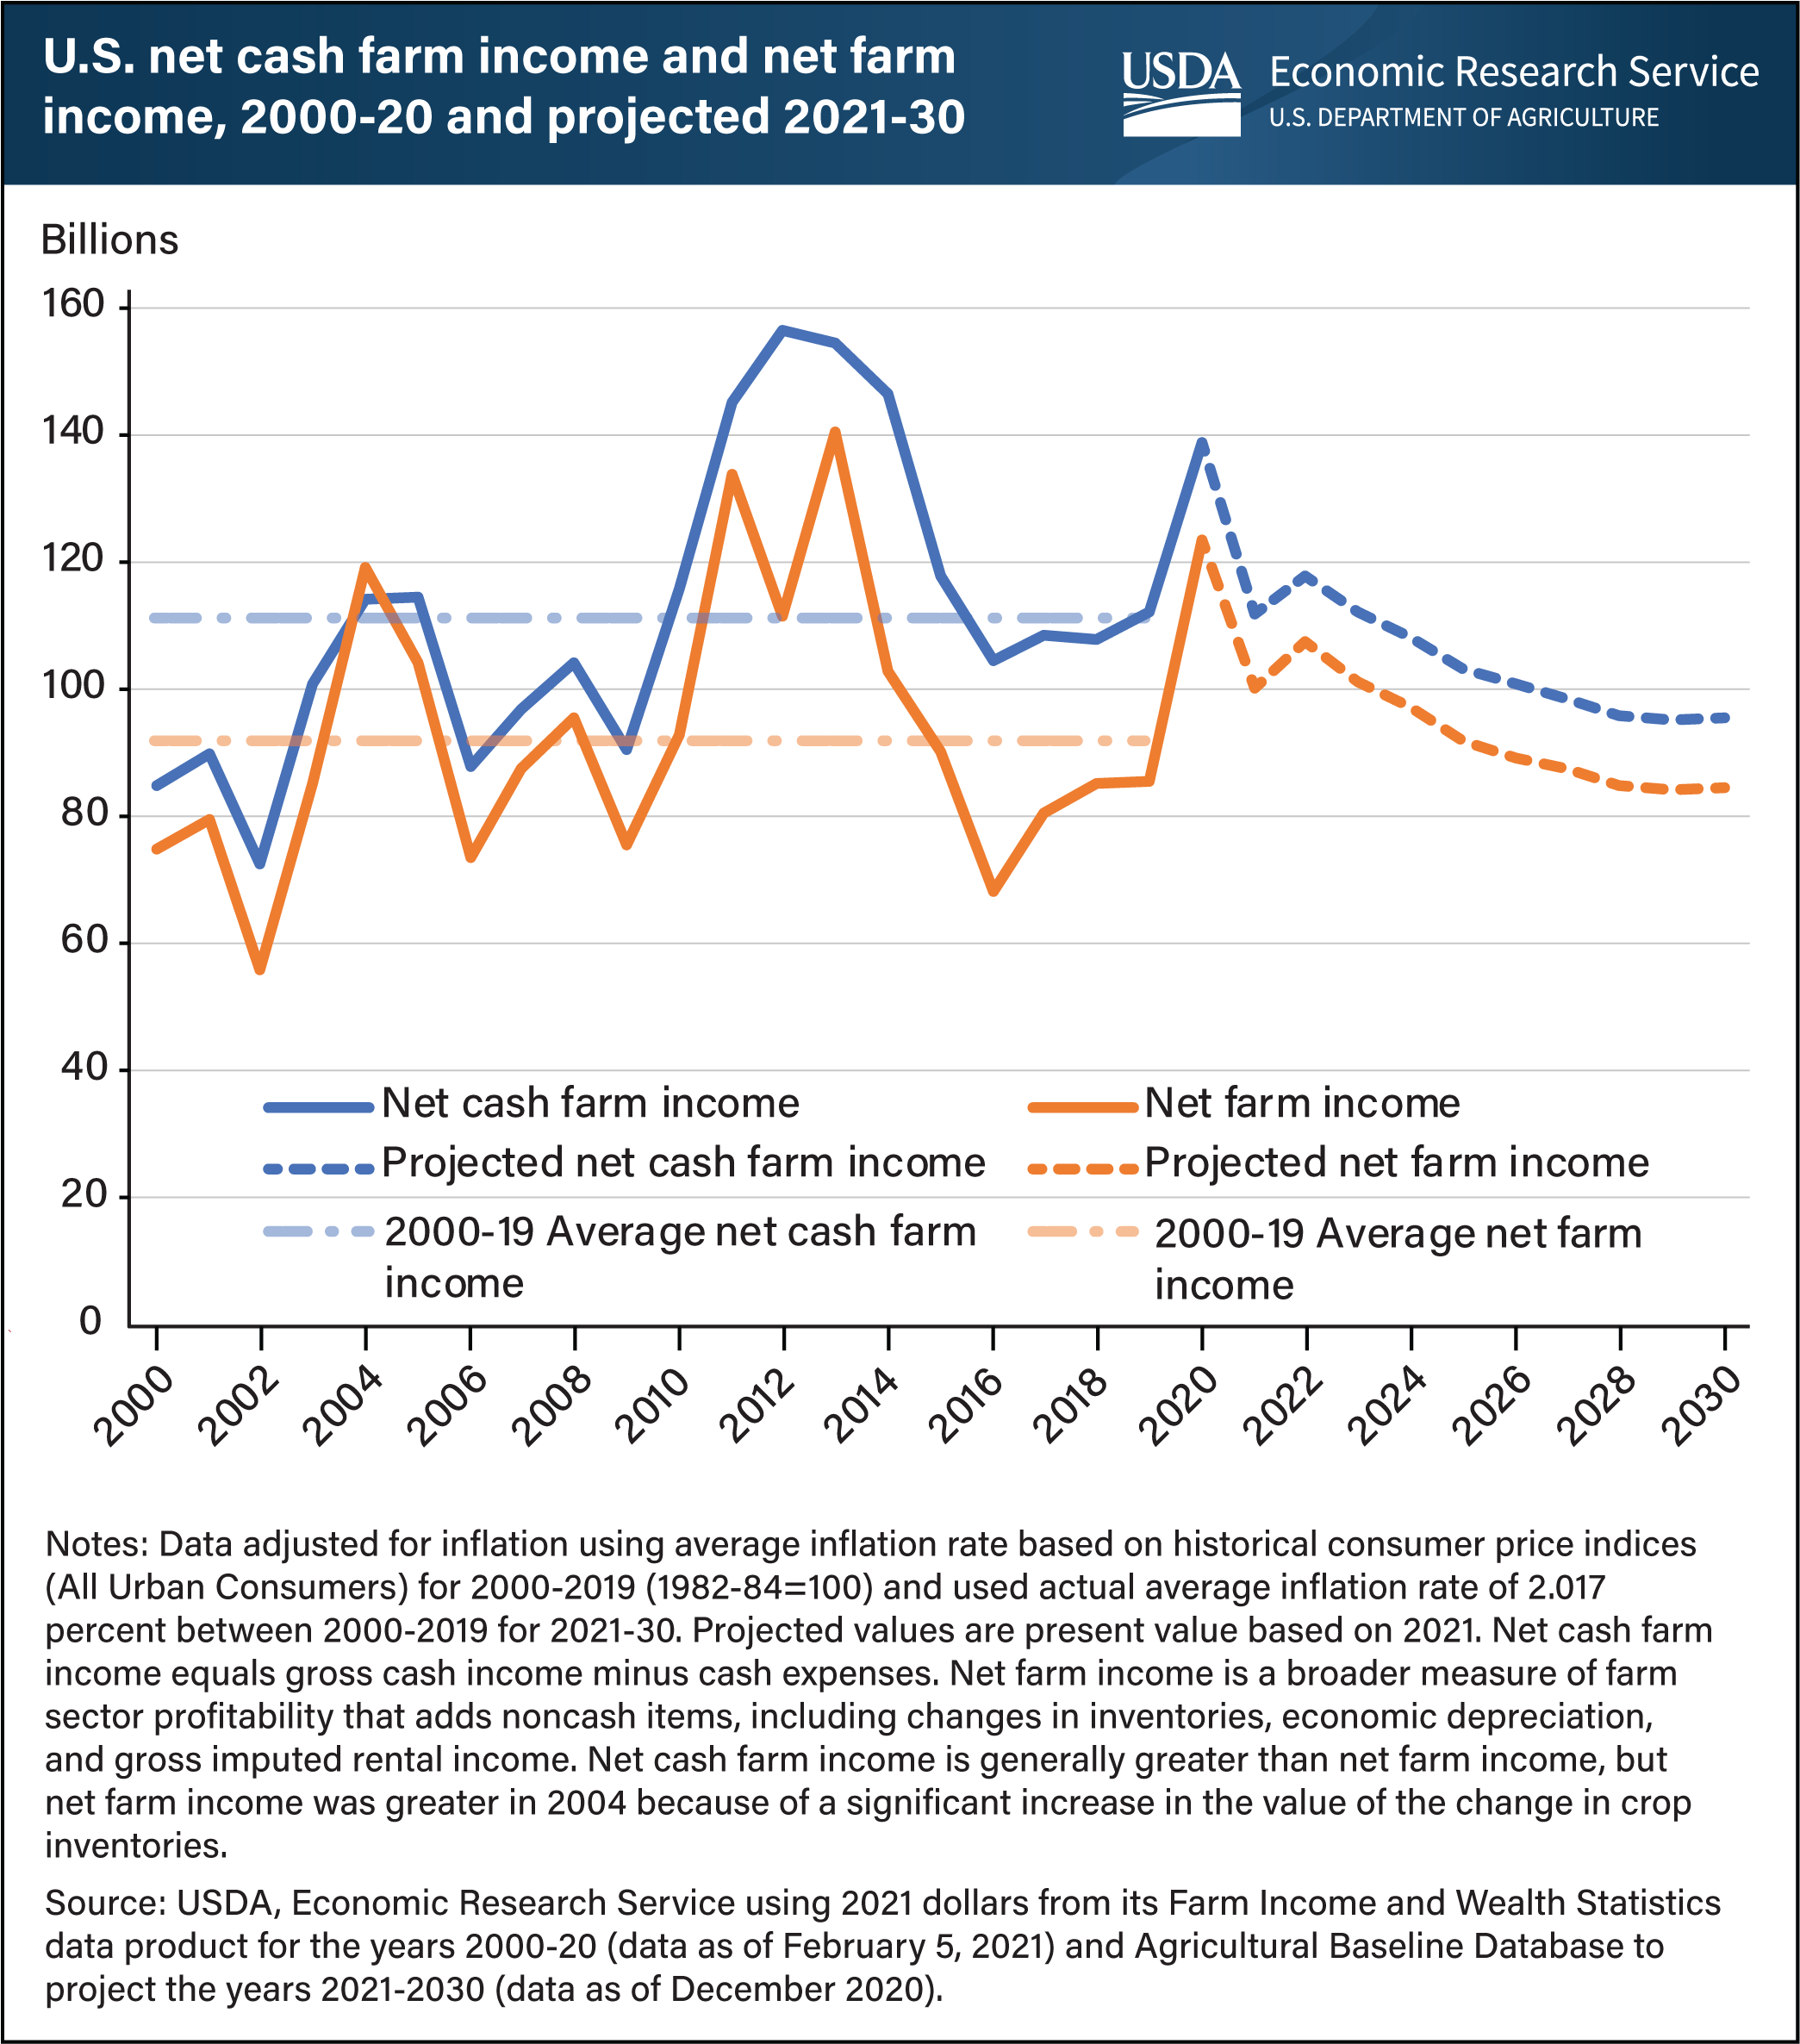
USDA, Economic Research Service (ERS) provides estimates, forecasts, and projections for net cash farm income and net farm income—two major profitability indicators of the financial health of the U.S. agricultural sector. Net farm income is a broader measure of farm sector profitability that incorporates noncash items, including changes in inventories, economic depreciation, and gross imputed rental income. Net cash farm income, on the other hand, includes only gross cash income minus all cash expenses. Net cash farm income and net farm income estimates will not be available for 2020 until September 2021, but forecasts are available. In 2020, ERS forecasts net farm income to be at $123 billion, which was $31 billion more than the 20-year average and $38 billion (or 44 percent) higher than in 2019. ERS forecasts for net cash farm income in 2020 is close to $139 billion. This amount was $43 billion more than the 20-year average from 2000-2019 and $27 billion (or 25 percent) more than in 2019. ERS forecasts that both indicators increased significantly in 2020 as direct government payments to farm operations reached their highest level ever because of COVID-19 related aid, such as the Coronavirus Food Assistance Programs (CFAP) and the Paycheck Protection Program (PPP). In 2021, ERS projects direct government payments to fall, pushing down both profitability indicators. Further projections estimate these profitability indicators to rise in 2022, then level off through 2030 because of a projected increase in production expenses. In 2030, both measures of farm income are projected to be lower than their 2020 forecasts. Net farm income is projected to remain slightly higher than the recent 20-year average, but net farm cash income is projected to be lower for 2021-30. This chart is based on data found in the ERS data products Farm Income and Wealth Statistics and Agricultural Baseline Database, updated February 2021.
We’d welcome your feedback!
Would you be willing to answer a few quick questions about your experience?