Fertilizer costs shape U.S. corn production expenses
- by Monte Vandeveer and Amy Boline
- 4/12/2021

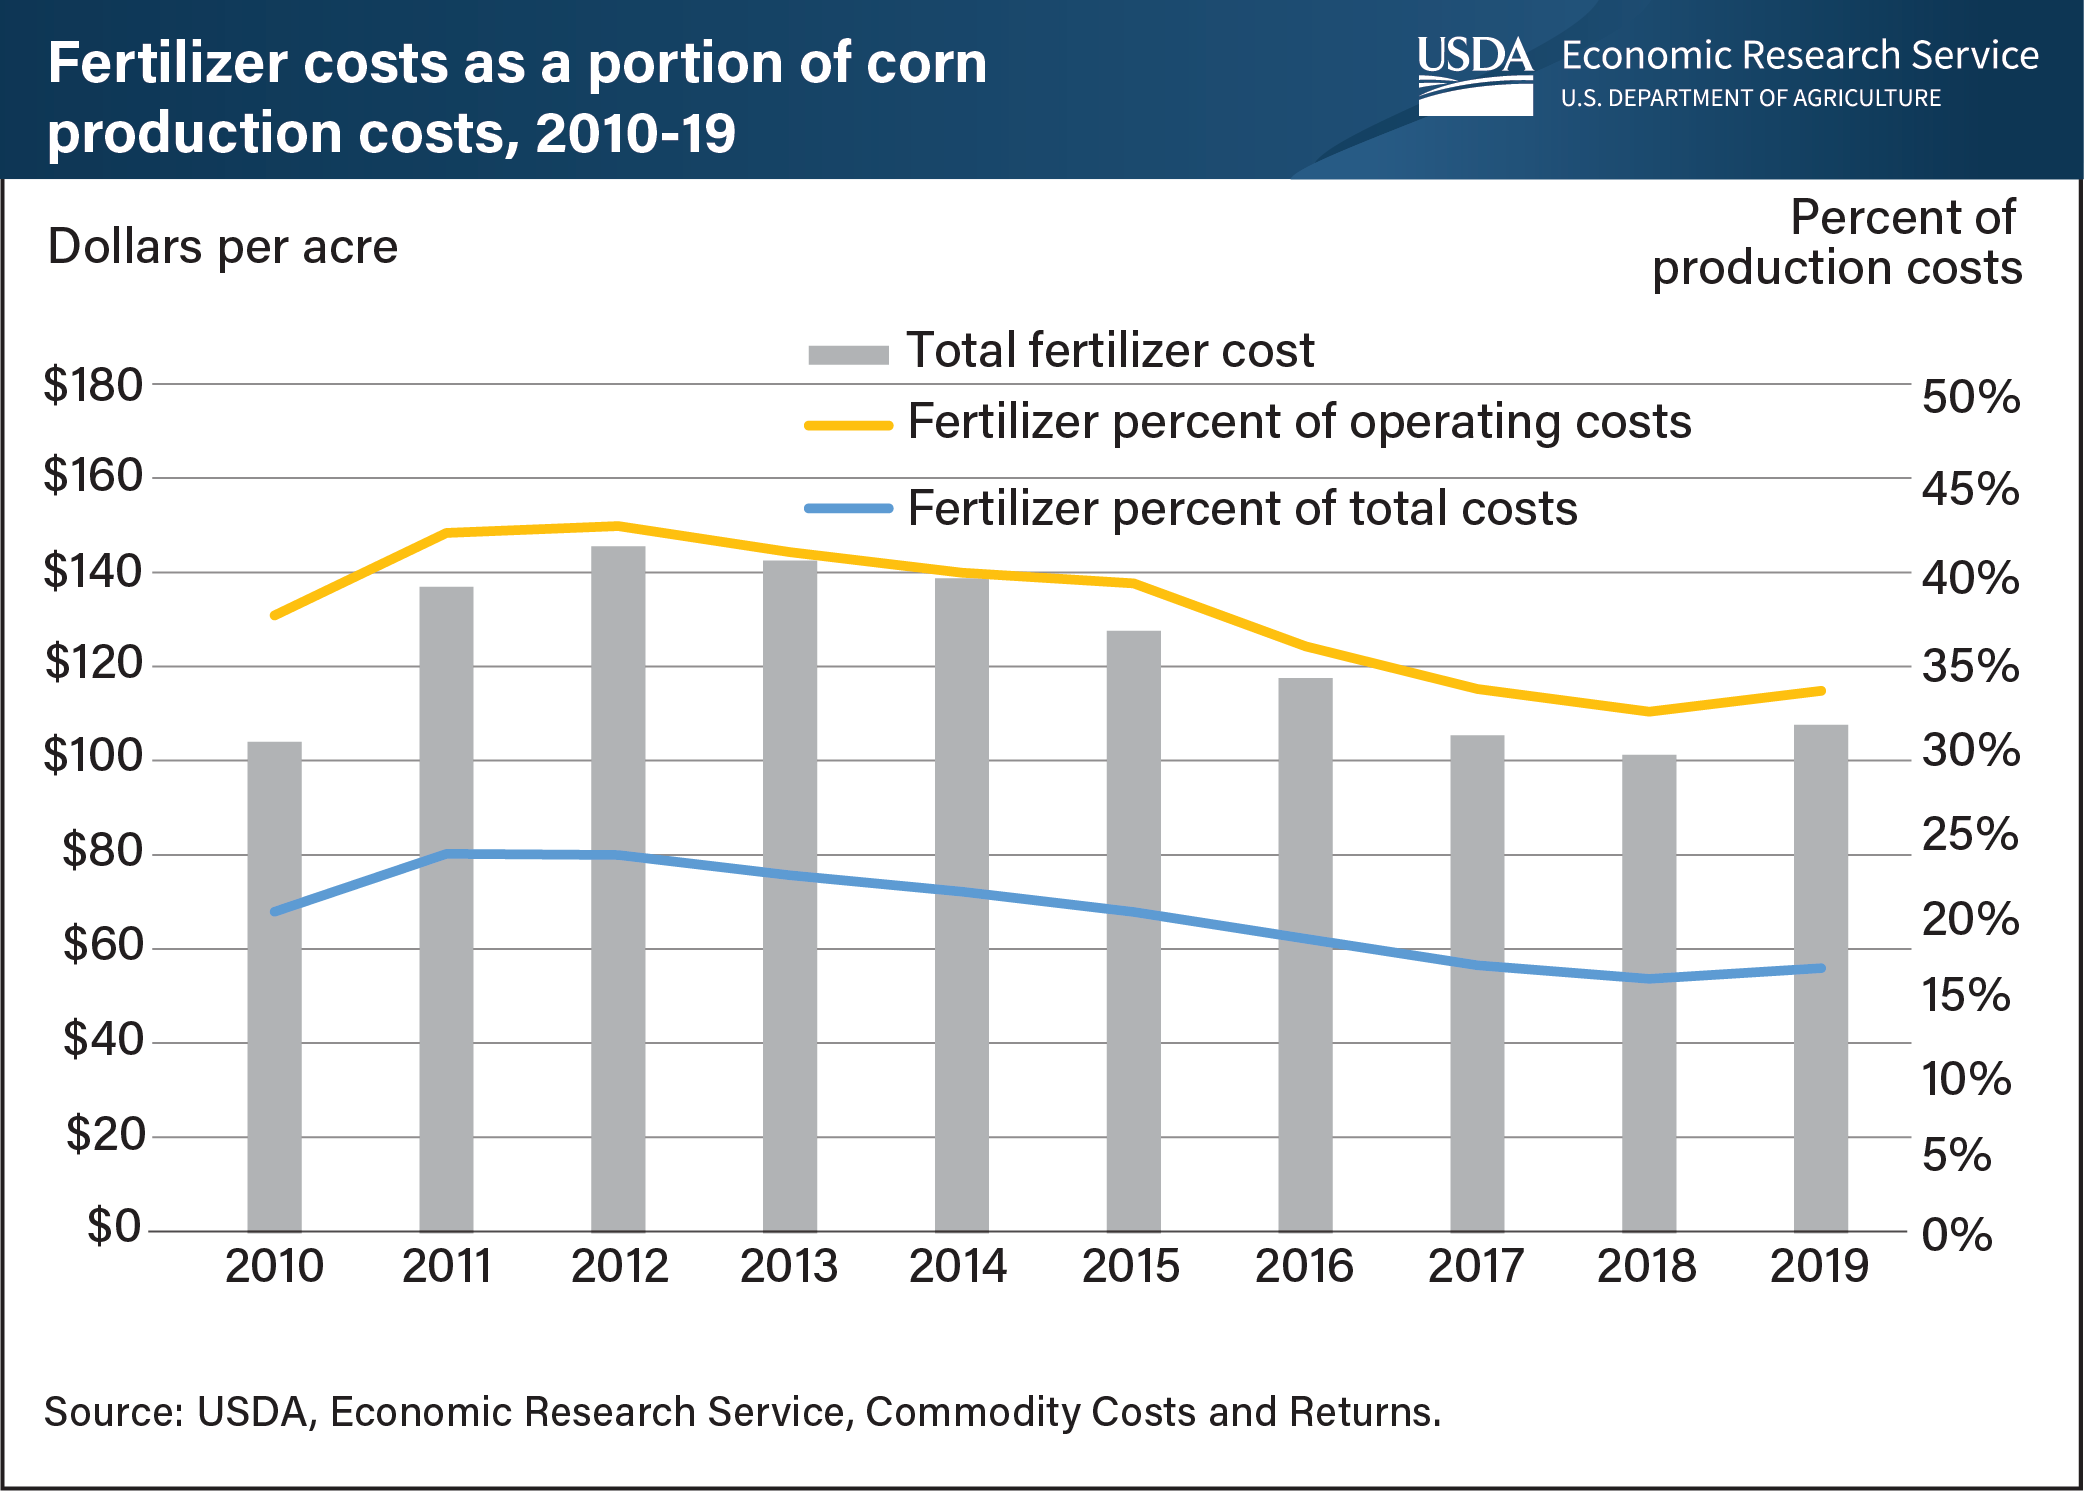
USDA’s Economic Research Service (ERS) reports production costs for corn and other major commodities in Commodity Costs and Returns, which includes estimated fertilizer costs for corn at the national level. From 2010 to 2019, fertilizer was a major expense in U.S. corn production, accounting for 33 to 44 percent of operating costs—a category that includes other variable expenses like seed, chemicals, fuel, and repairs. Fertilizer also comprised 16 to 24 percent of the average corn producer’s total costs, which include overhead charges like land costs, machinery depreciation, and farm taxes. Most U.S. corn acres are planted in April and May, and growers often purchase their inputs months in advance. Prices for fertilizer have risen since August 2020, with an even more pronounced surge starting in January 2021. Farmers who made fertilizer purchases for the 2021 corn crop before this uptick may incur similar fertilizer costs to the 2019 and 2020 crops, while those who have waited may pay significantly higher costs. This chart is drawn from ERS’s Commodity Costs and Returns data product.

