
U.S. exports of turkey to China resume in 2020 after trade ban lifted
- by Grace Grossen
- 4/7/2021
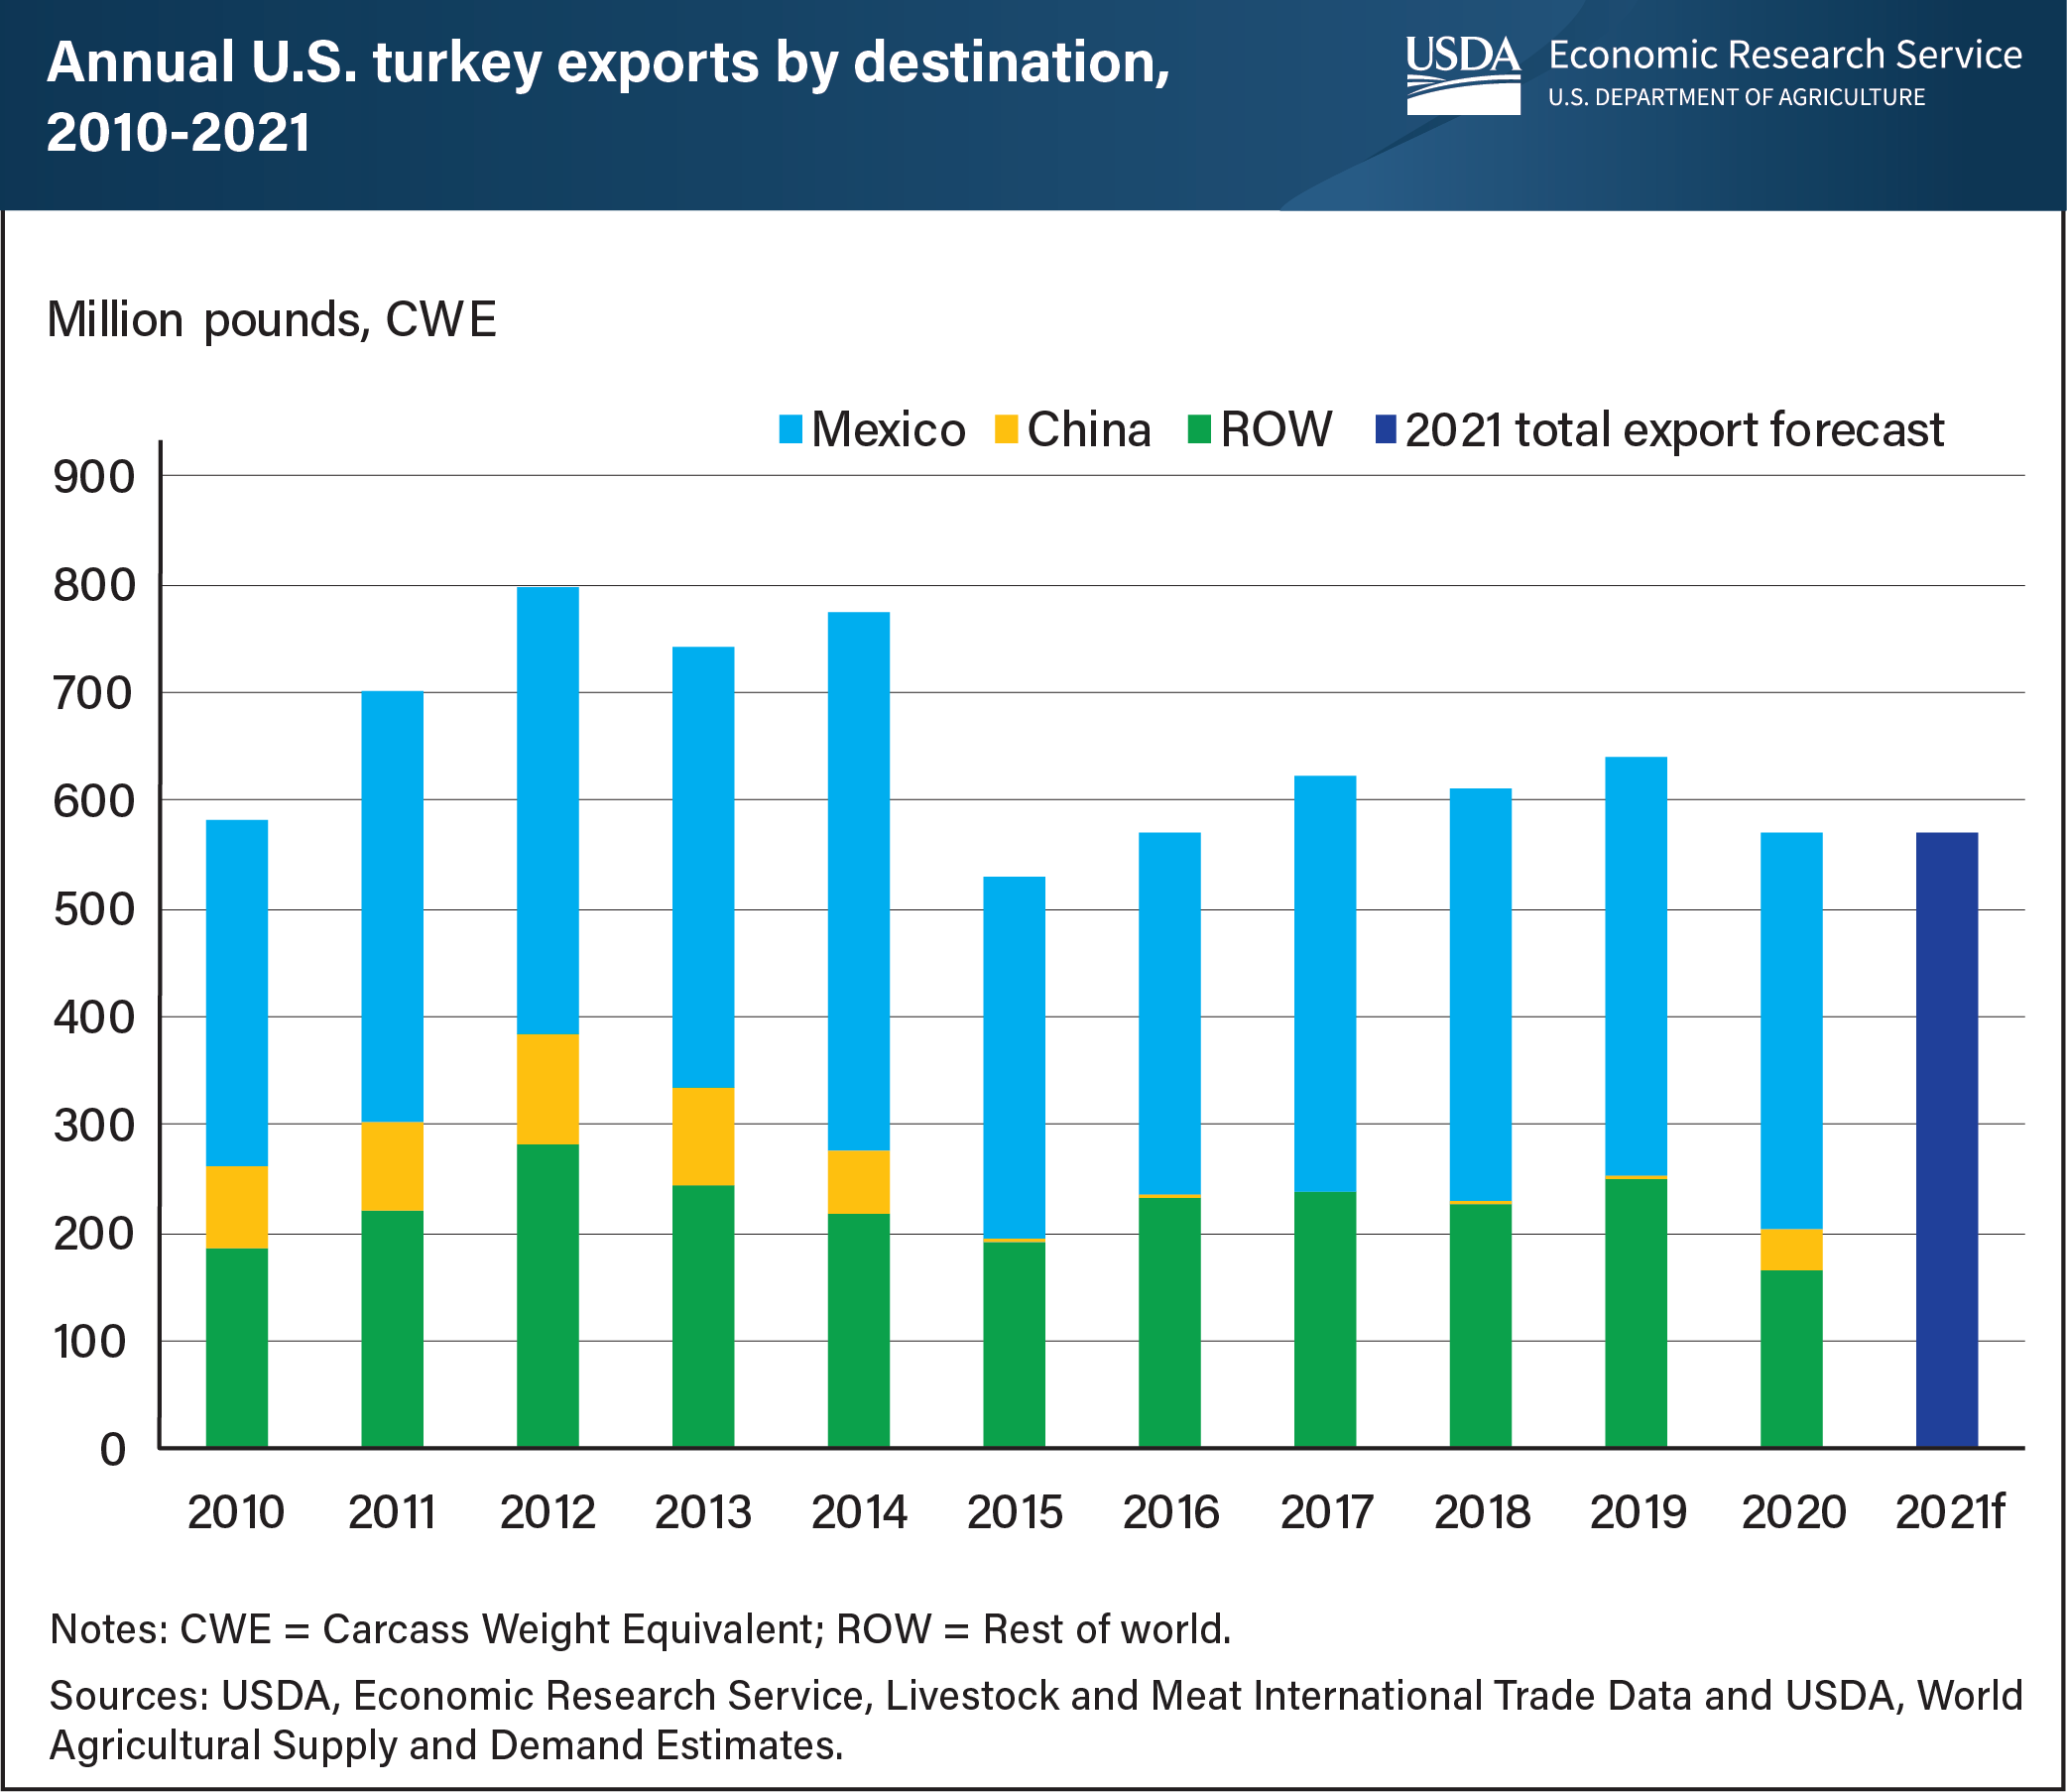
Exports accounted for about 10 percent of the 5.7 billion pounds of turkey produced in the United States in 2020. While exporters sent the majority of turkey shipments to Mexico, China re-emerged as a buyer for the first time since 2014. In January 2015, China banned all imports of poultry from the United States because of U.S. outbreaks of highly pathogenic avian influenza (HPAI). After nearly 5 years, China lifted its ban on U.S. poultry in November 2019. As China faced a protein deficit caused by African swine fever, demand for turkey products increased, causing China to quickly become the second largest foreign market for U.S. turkey, after Mexico. Despite this new growth market, turkey exports in 2020 fell from 2019 levels as global demand decreased and domestic production declined year over year as a result of the COVID-19 pandemic. Between 2010 and 2014, China's share of U.S. turkey exports averaged about 11 percent, or around 81 million pounds. China’s share of U.S. turkey exports in 2020 was around 7 percent, or 38 million pounds. The new demand from China did not make up for falling demand for turkey in Mexico and other parts of the world. Exports to Mexico were 22 million pounds below 2019. Exports to the rest of the world declined by 83 million pounds, including decreases in shipments to Benin, Hong Kong, South Africa, Peru, and Japan. In 2021, total turkey exports are forecast at 570 million pounds, which would be a slight decrease from 2020. This chart is drawn from the USDA, Economic Research Service’s Livestock, Dairy and Poultry Outlook, February 2021.
We’d welcome your feedback!
Would you be willing to answer a few quick questions about your experience?