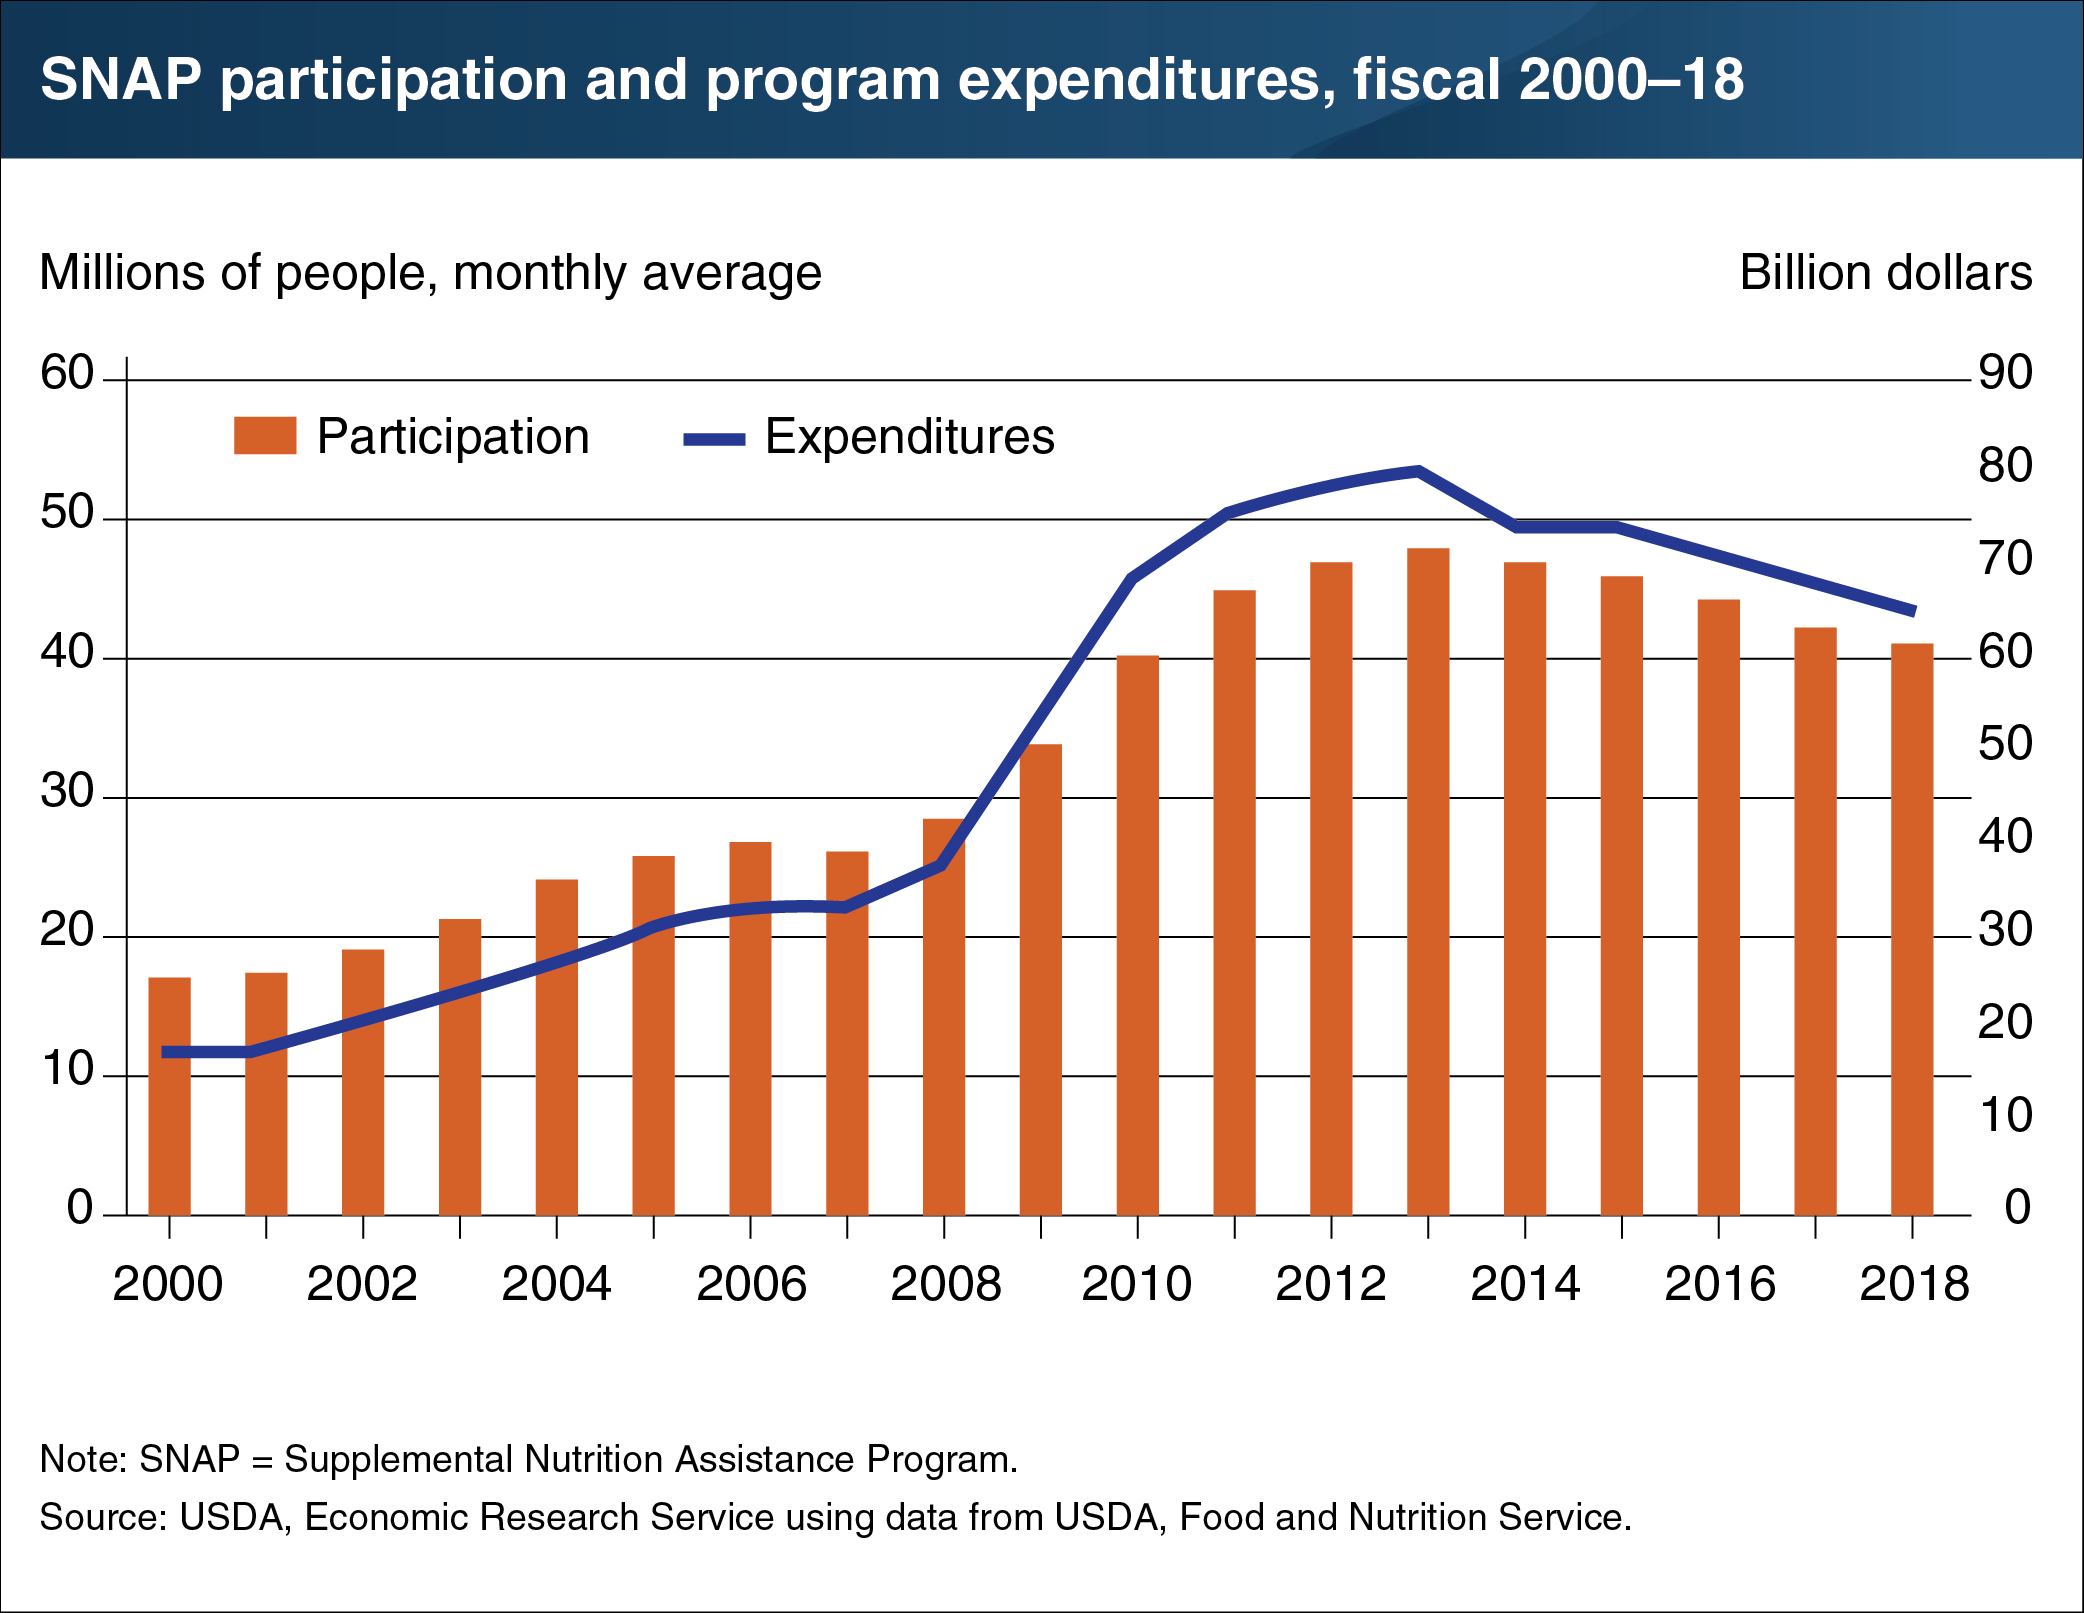
SNAP participation continued to contract in 2018
- by Victor Oliveira and Xinzhe Cheng
- 5/7/2019

The Supplemental Nutrition Assistance Program (SNAP) is the cornerstone of USDA’s food and nutrition assistance programs, accounting for 68 percent of all Federal food and nutrition assistance spending in fiscal 2018. An average of 40.3 million people per month participated in the program in fiscal 2018, 4 percent fewer than in fiscal 2017. As the fifth consecutive year of declining participation, fiscal 2018’s caseload was 15 percent less than the historical high average of 47.6 million participants per month in fiscal 2013. The decrease in SNAP participation in 2018 was likely associated with the country’s continued economic improvement in recent years. Federal spending for SNAP fell by 5 percent in fiscal 2018 to $65.0 billion—19 percent less than the historical high of $79.9 billion set in fiscal 2013. This chart appears in the ERS report, The Food Assistance Landscape: FY 2018 Annual Report, released on April 18, 2019.


