
U.S. agricultural export and import forecasts both revised upward for fiscal year 2018; trade balance stable
- by Bryce Cooke
- 6/13/2018
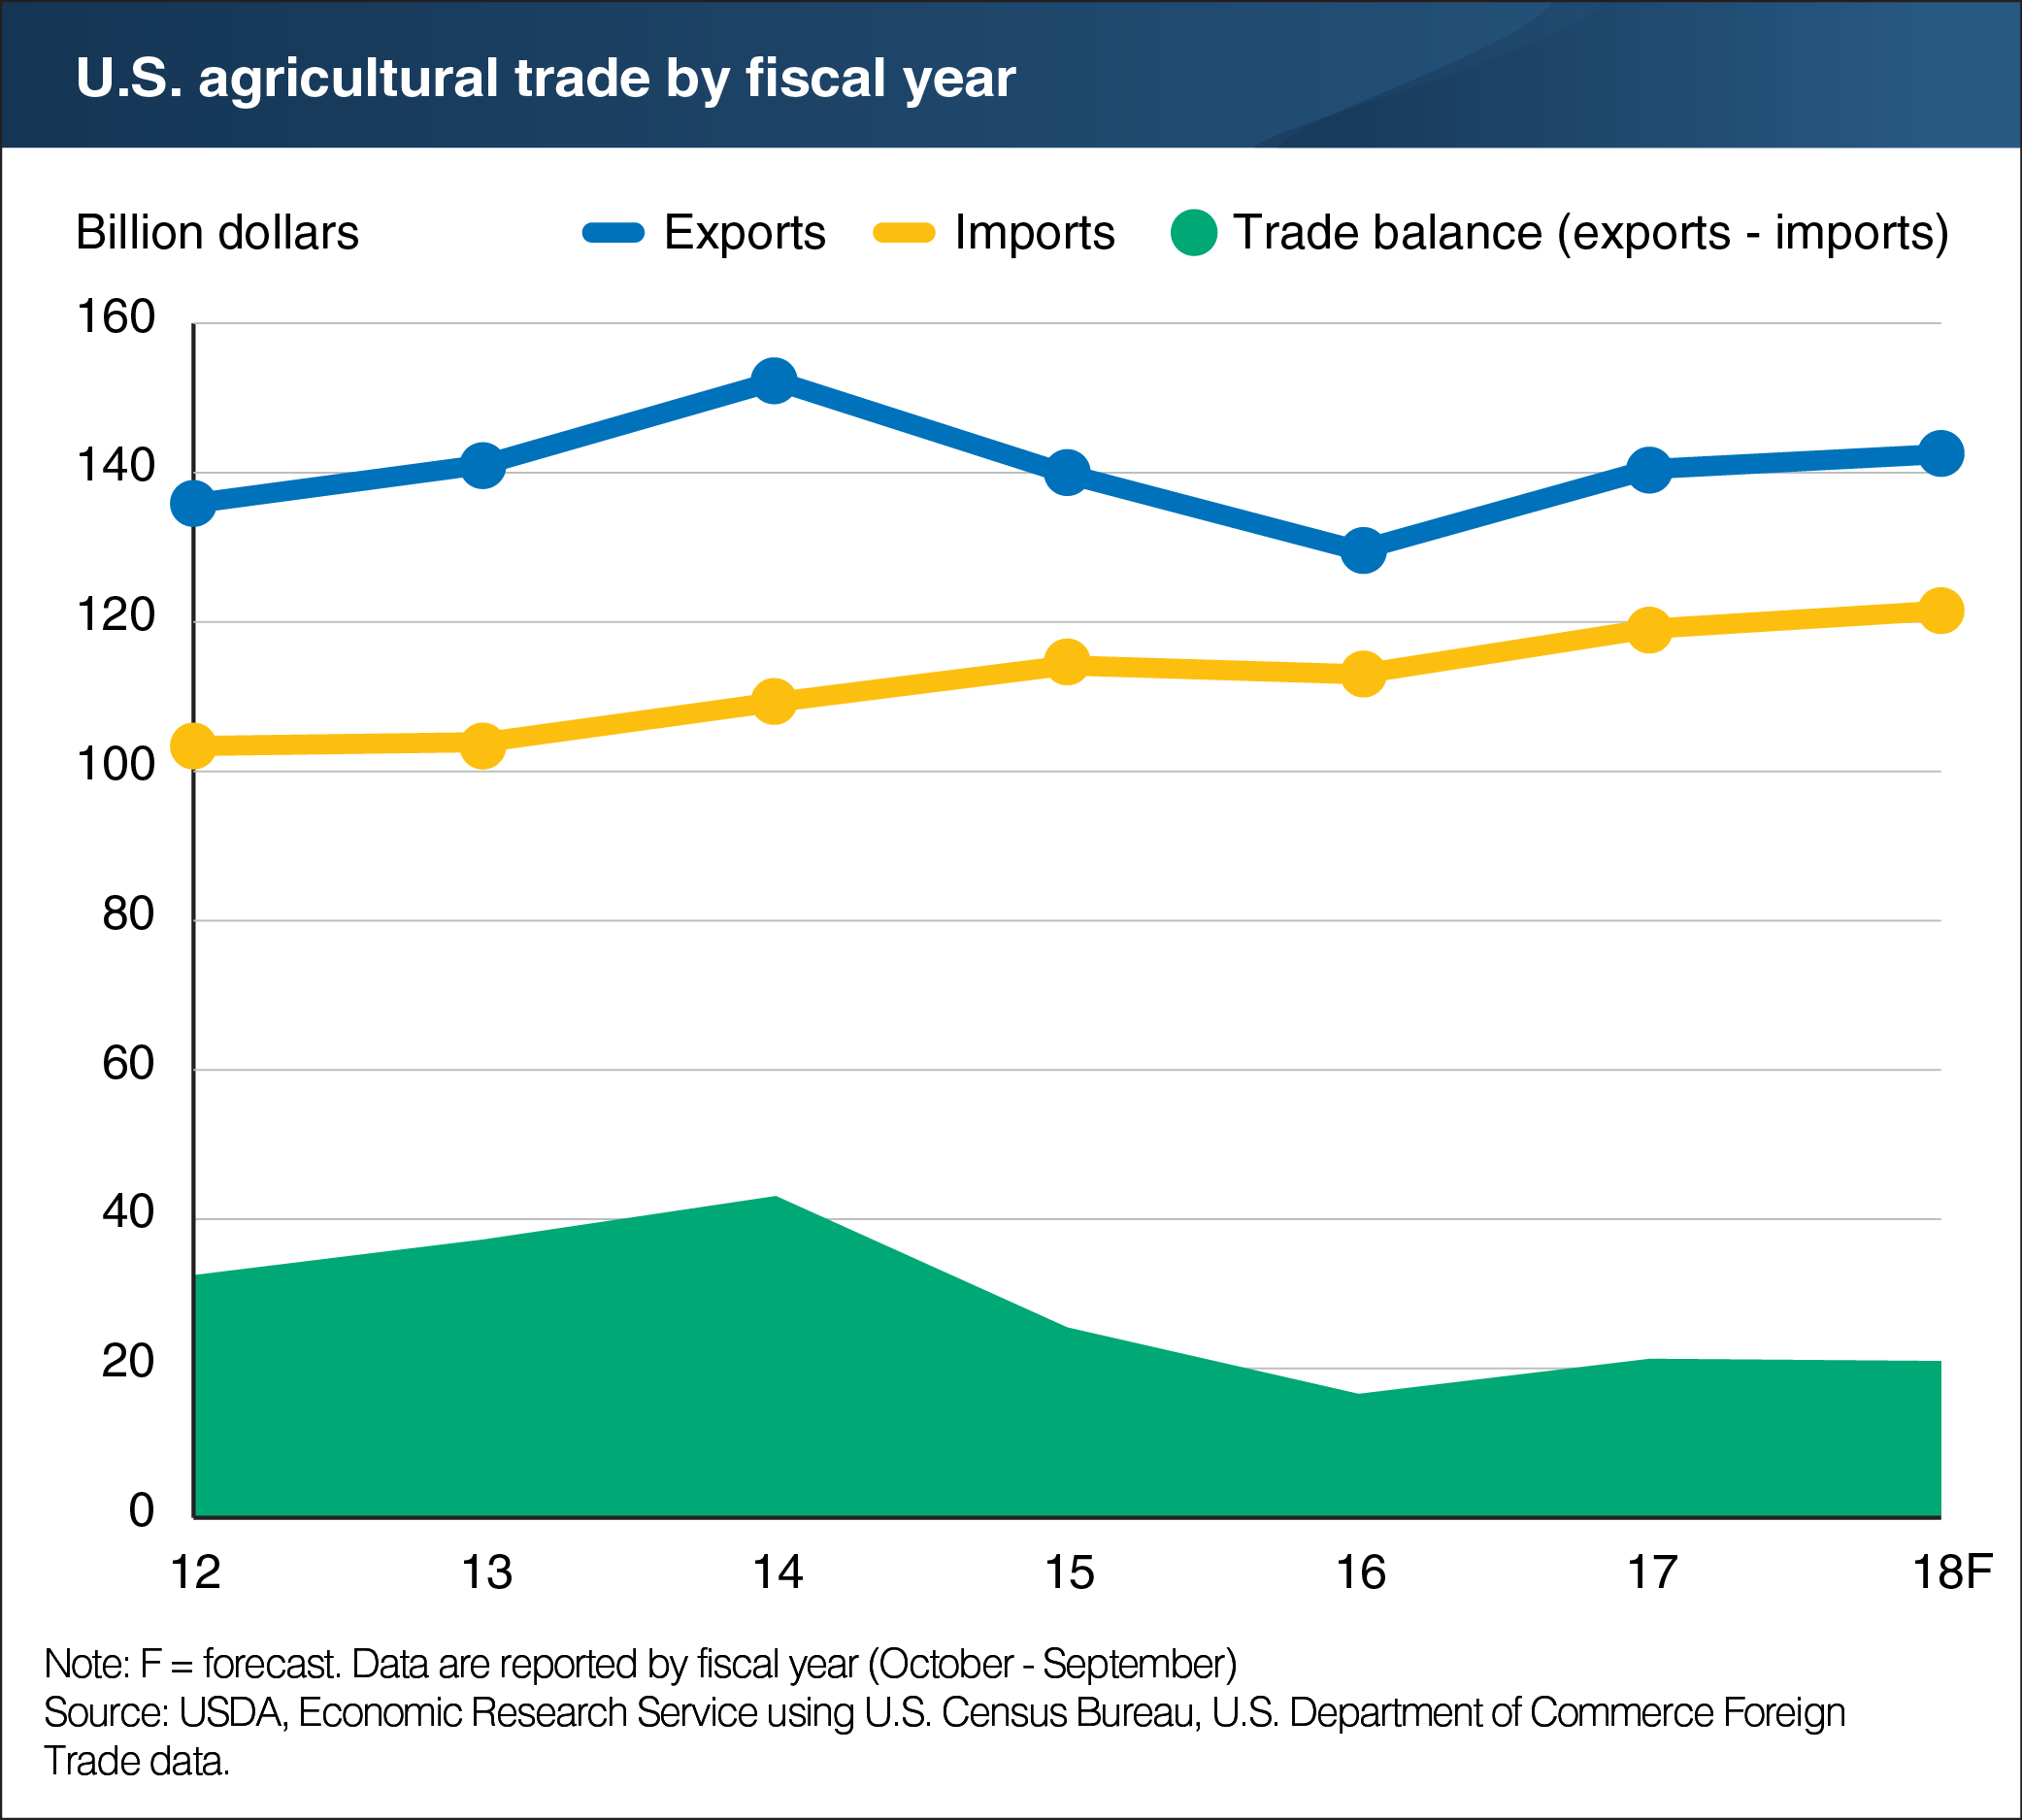
U.S. agricultural exports are forecast to reach $142.5 billion in fiscal year 2018, primarily due to expected increases in corn and cotton exports. At the same time, U.S. agricultural imports are expected to reach $121.5 billion, driven by rising imports of animal and horticultural products. In both cases, these May forecasts represent an increase of $3 billion over the previous respective forecasts in February. The resulting U.S. agricultural trade surplus for 2018 is expected to be $21 billion. While the United States has consistently run an agricultural trade surplus, the size of the surplus has declined since 2014. This reflects steadily rising imports amid more variable export patterns. As prices for corn and soybeans, major export commodities, rose sharply in the early 2010s and later fell after 2014, the value of U.S. exports rose and fell as well. Additionally, the U.S. dollar experienced a sustained period of appreciation between late 2014 and early 2017. A stronger dollar can make imports more attractive to U.S. consumers while increasing the relative price of U.S. goods sold to foreign markets. This chart is drawn from data discussed in ERS’s Outlook for U.S. Agricultural Trade Newsletter, released May 31, 2018.
We’d welcome your feedback!
Would you be willing to answer a few quick questions about your experience?