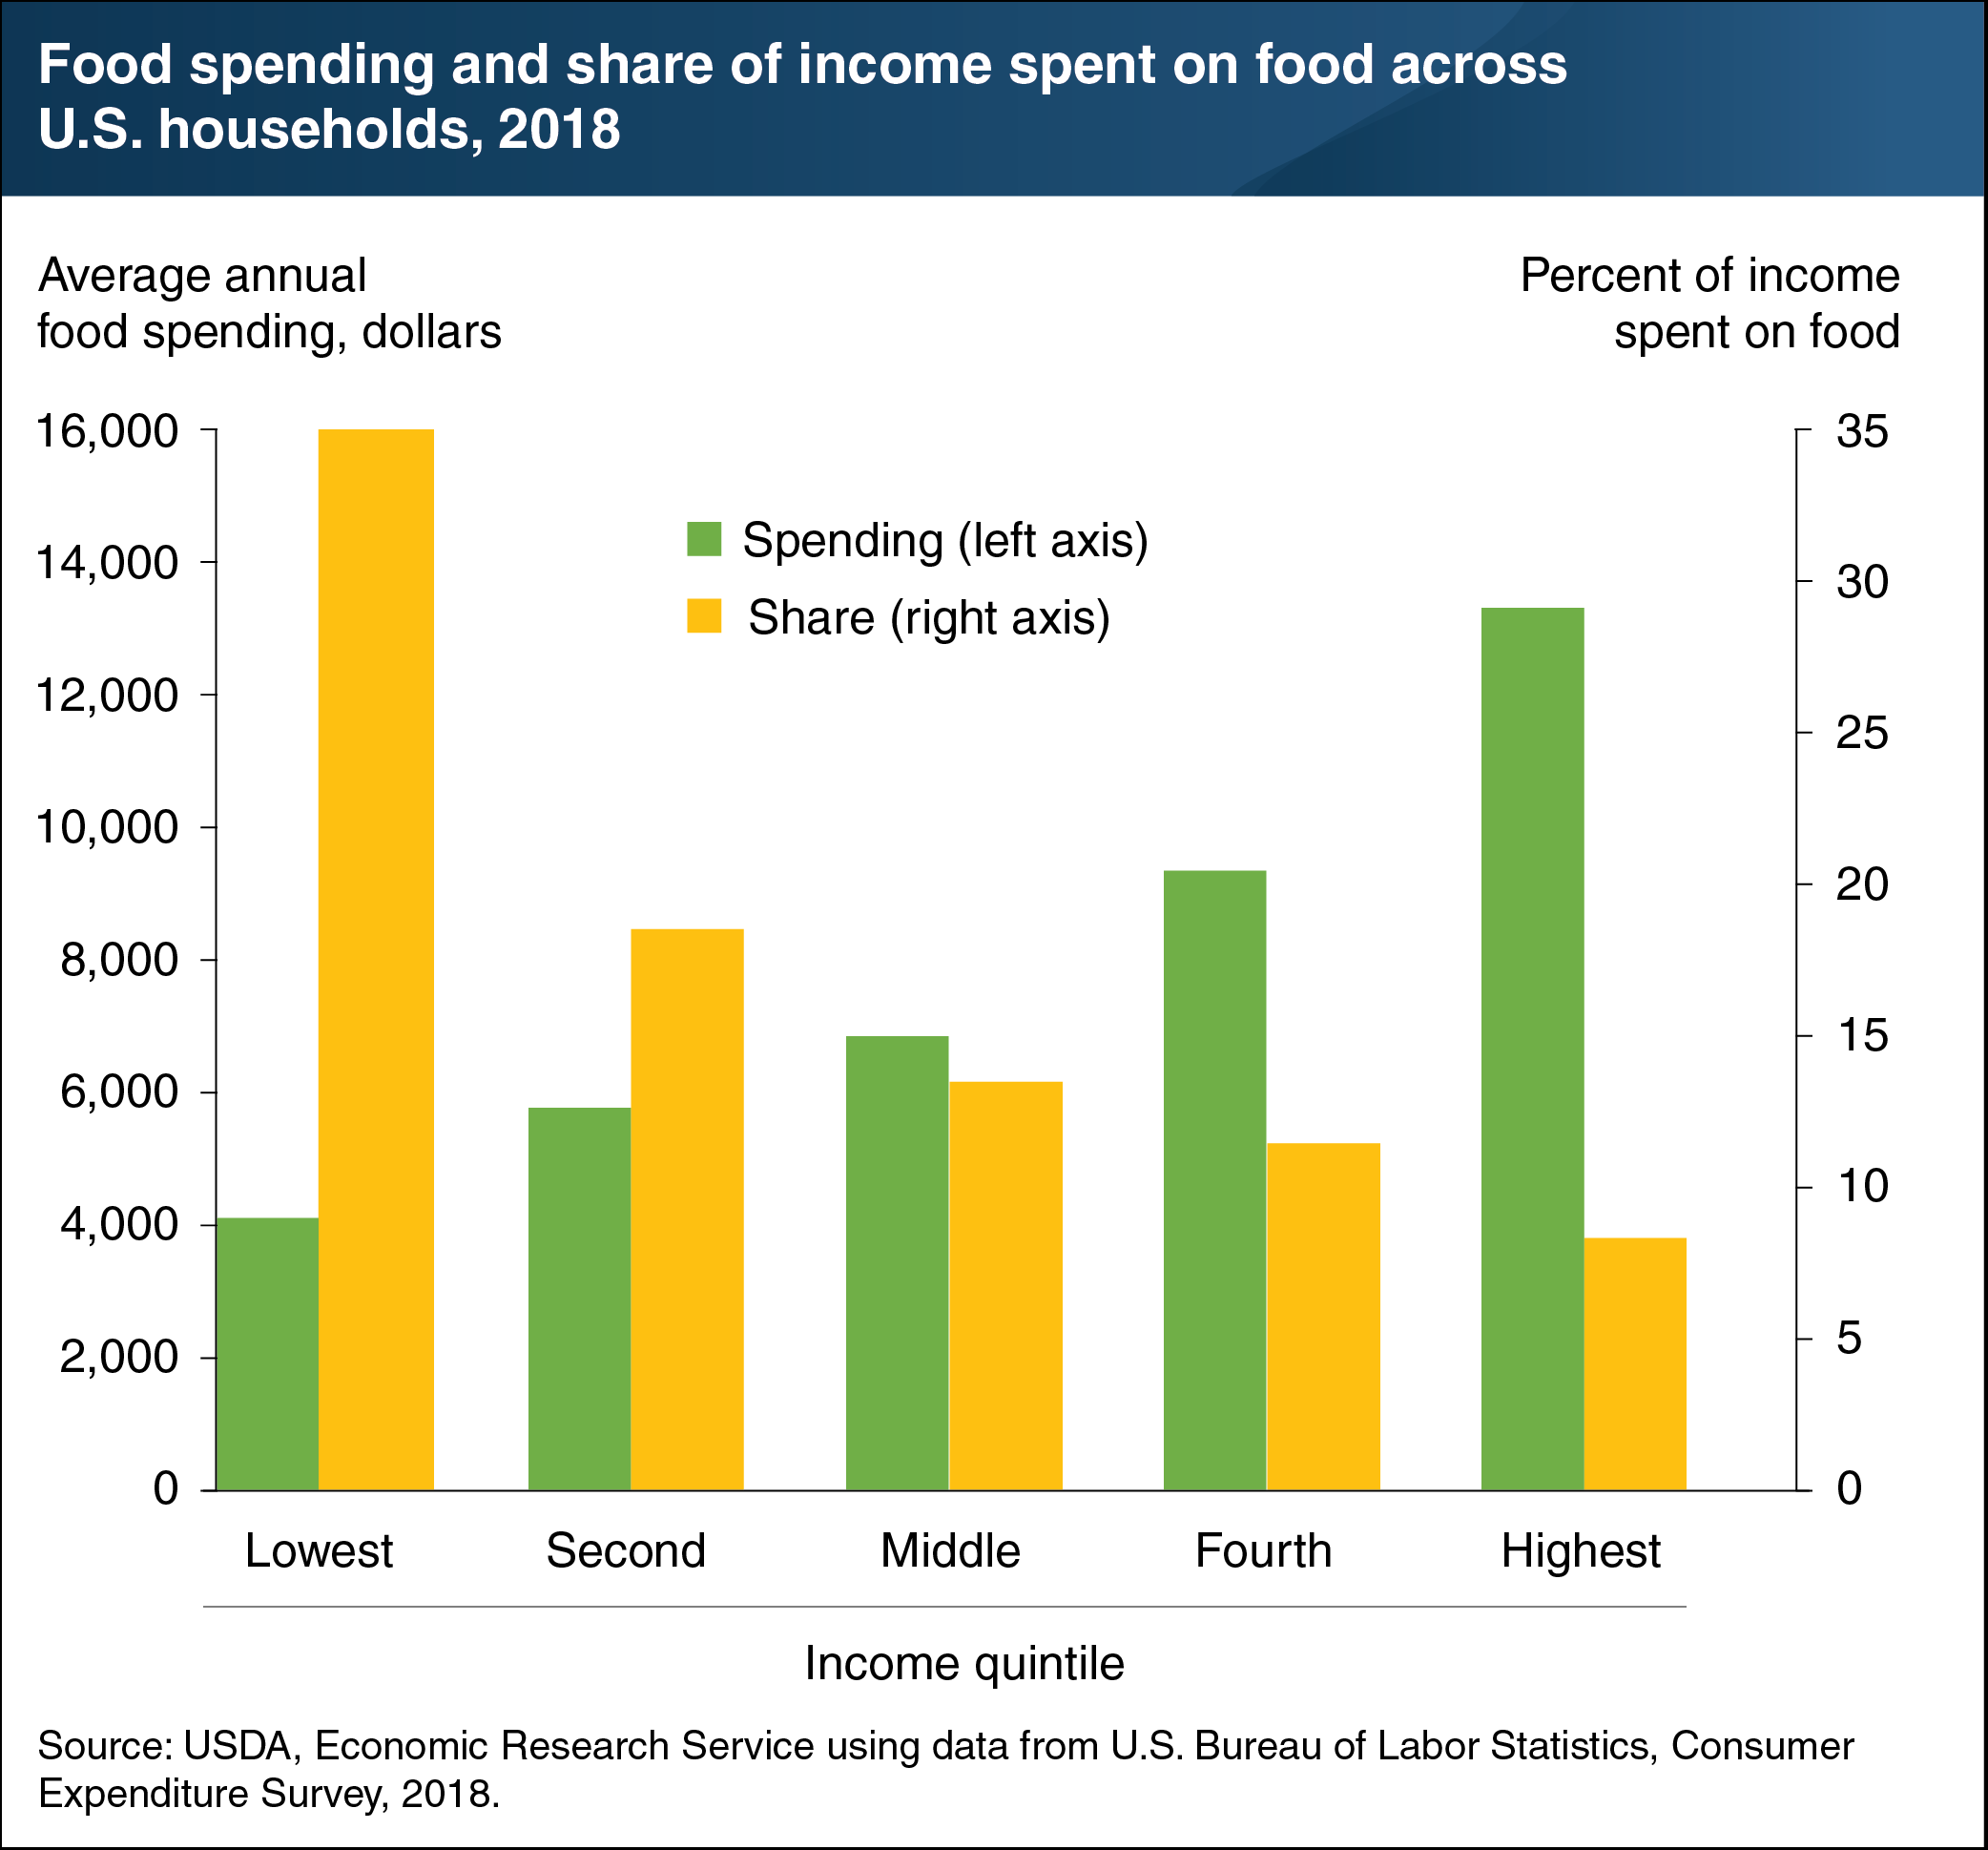
As income increases, the share of income spent on food falls
- by Gianna Short and Katherine Ralston
- 12/20/2019

As their incomes rise, households spend more money on food, but it represents a smaller share of their overall budgets. In 2018, households in the lowest income quintile, with an average 2018 after-tax income of $11,695, spent an average of $4,109 on food (about $79 a week). Households in the highest income quintile spent an average of $13,348 on food (about $257 a week). The three-fold increase in spending between the lowest and highest income quintiles is not the result of a three-fold increase in consumption. Rather, people choose to buy different types of food as they gain more disposable income. One example is dining out. One-third of food spending by the lowest income quintile goes to food away from home, whereas food away from home accounts for half of total food spending for the top quintile. Even with a shift to more expensive food options, as income increases, the percent of income spent on food goes down. In 2018, food spending represented 35.1 percent of the bottom quintile’s income, 13.6 percent of income for the middle quintile, and 8.2 percent of income for the top quintile. This chart appears in the Food Prices and Spending section of ERS’s Ag and Food Statistics: Charting the Essentials data product.

