

AW2019_06-DataFeature_Fig01_Stewart_Hyman
- by Hayden Stewart and Jeffrey Hyman
- 6/3/2019
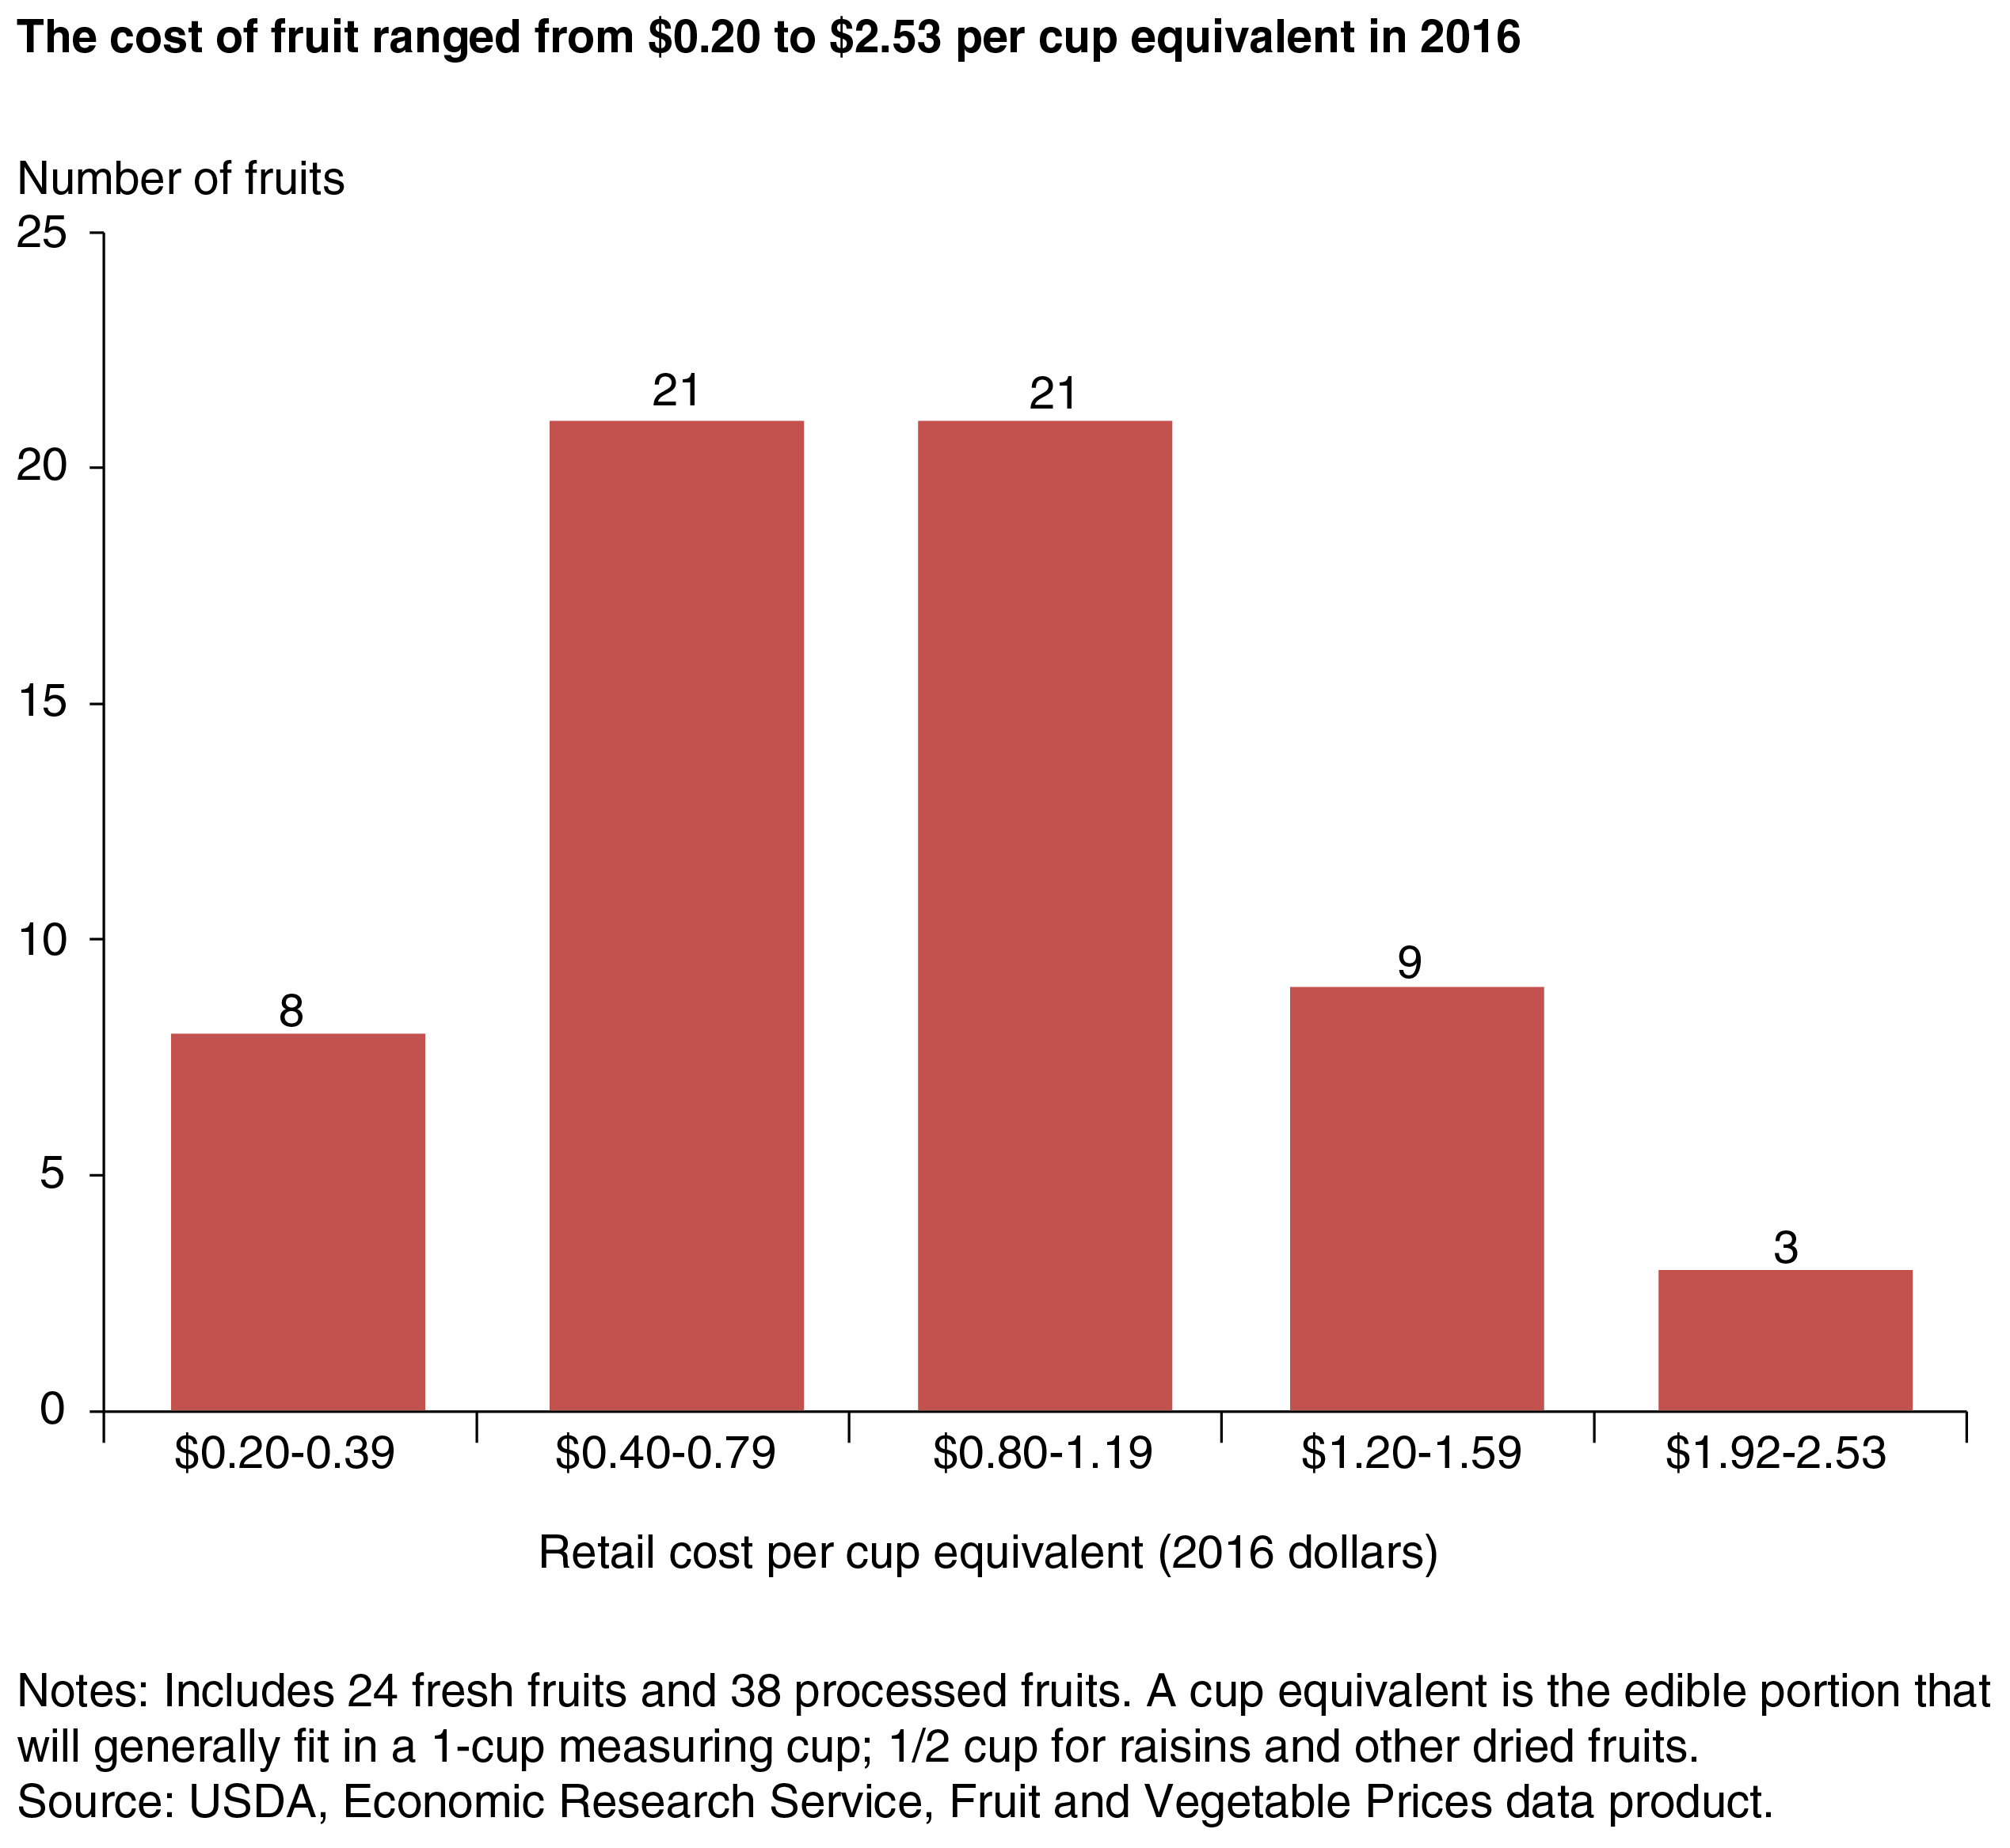
A bar chart showing the number of fresh and processed fruits in five cost ranges
Official websites use .gov
A .gov website belongs to an official government organization in the United States.
Secure .gov websites use HTTPS
A lock (
) or https:// means you’ve safely connected to the .gov website. Share sensitive information only on official, secure websites.
A bar chart showing the number of fresh and processed fruits in five cost ranges