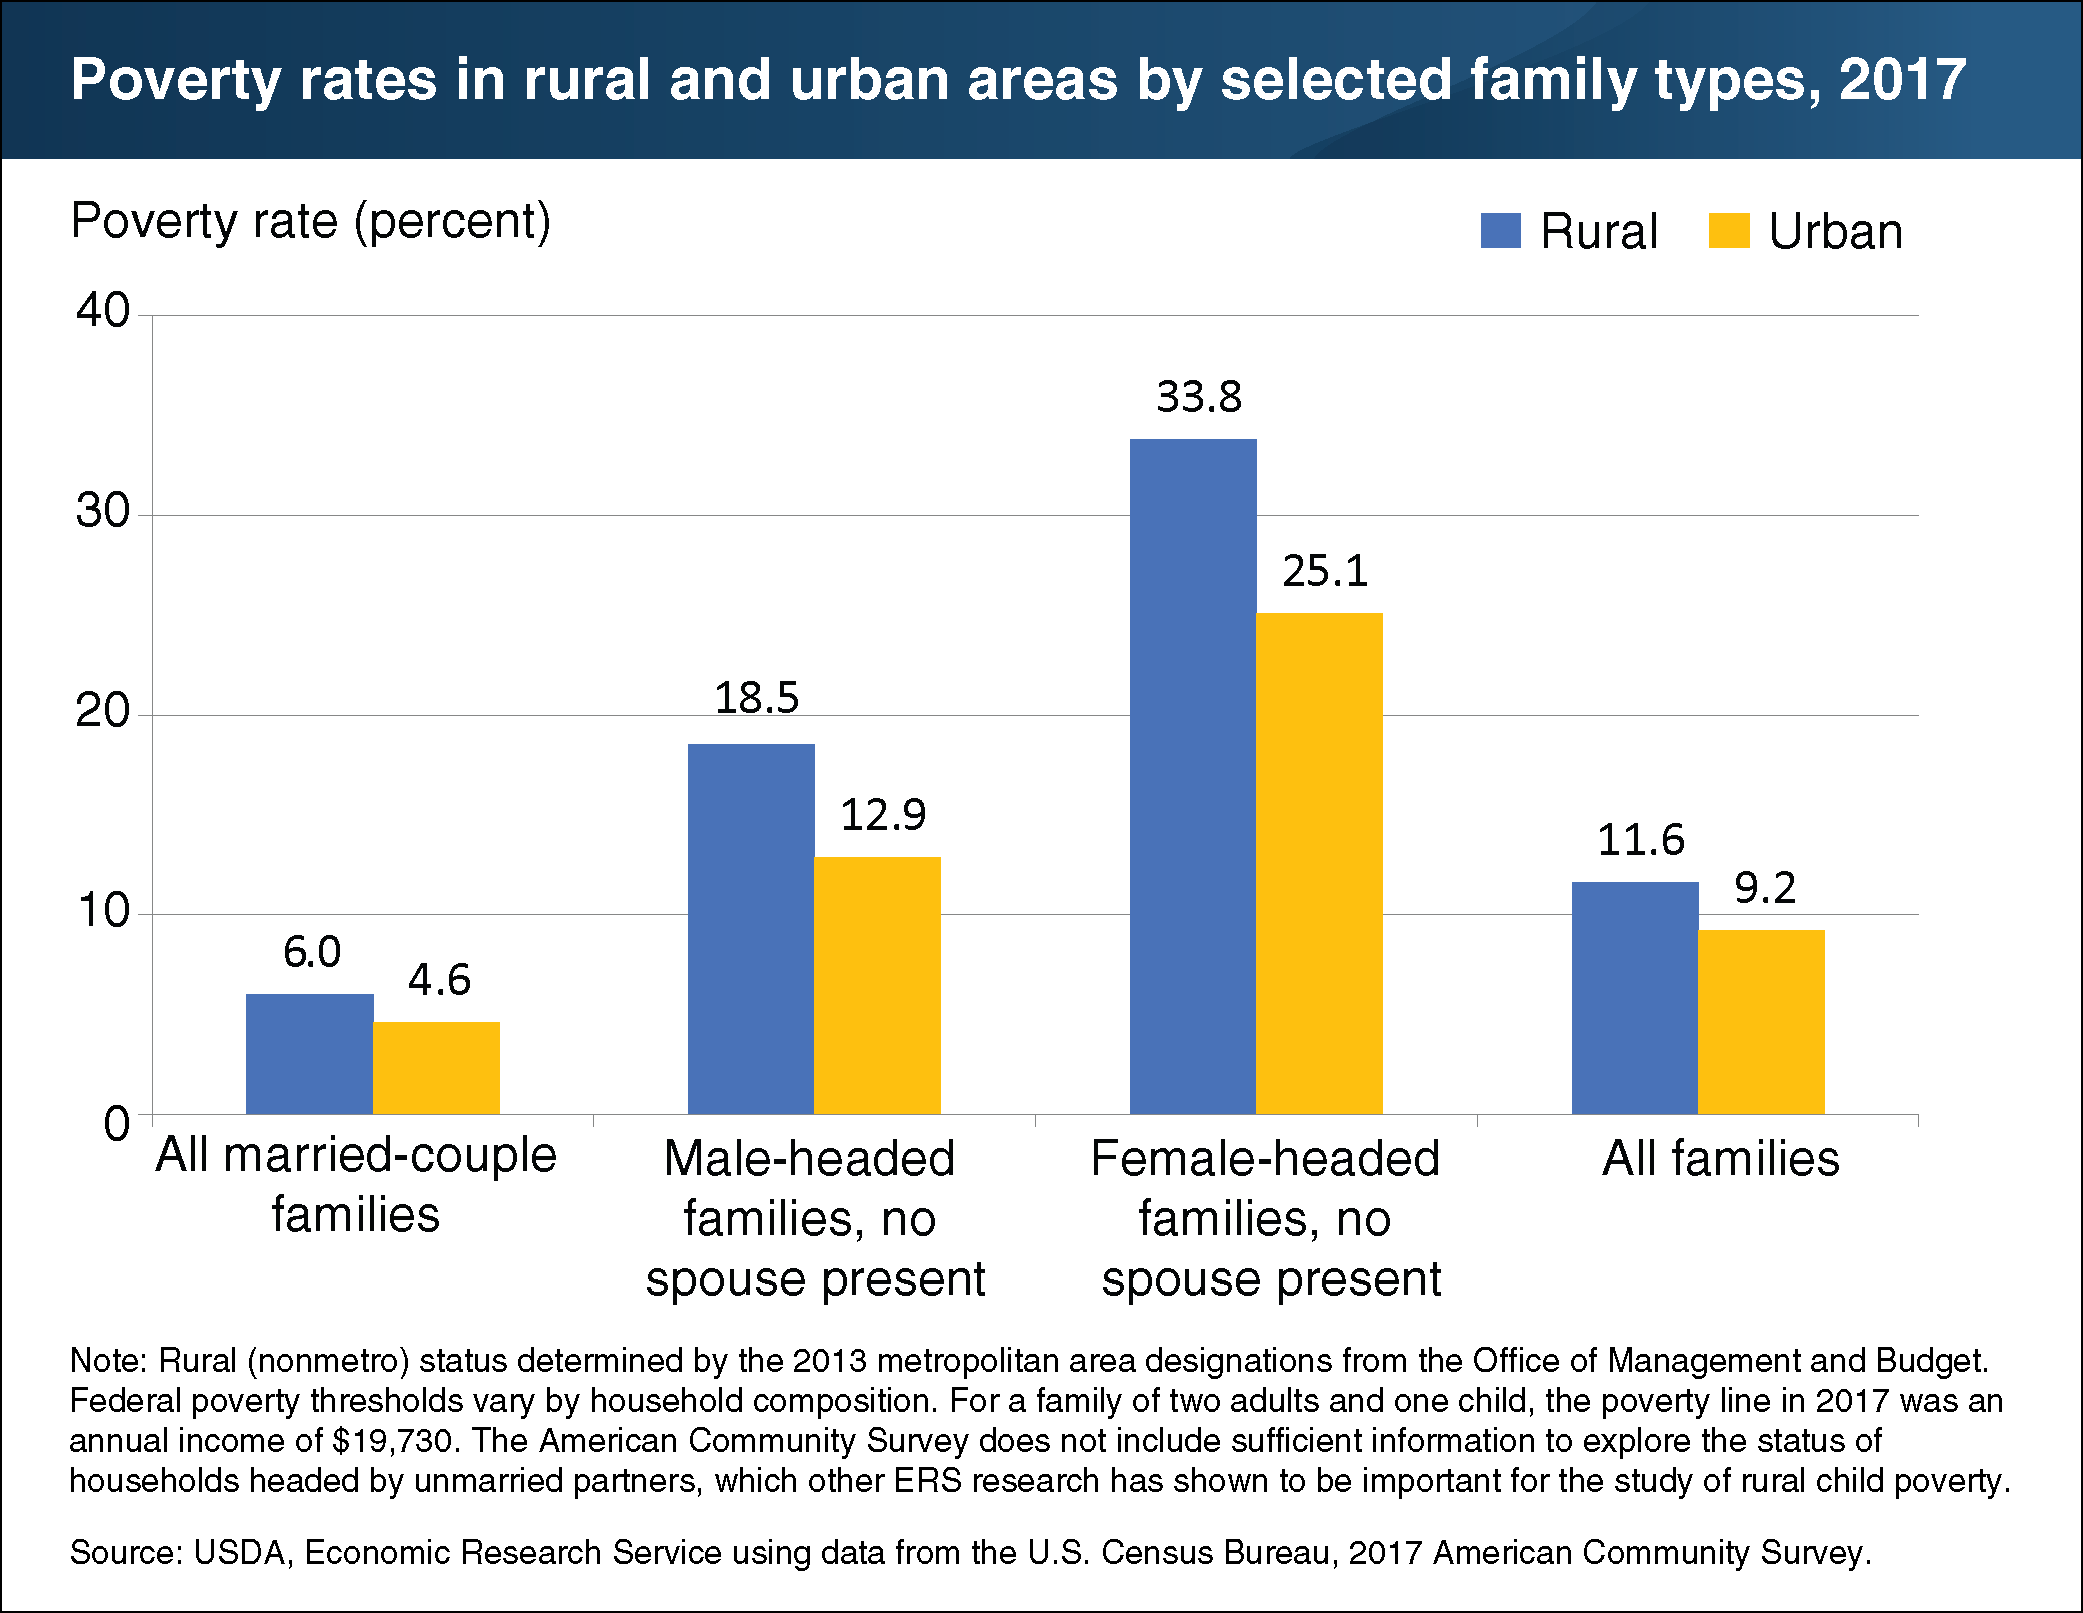
Rural families headed by single adults had higher poverty rates than urban counterparts in 2017
- by Tracey Farrigan
- 5/29/2019

Family type has a significant bearing on poverty. For example, families headed by two adults are likely to have more sources of income than single-adult families—and are therefore less likely to be poor. In 2017, nearly 33.8 percent of rural families headed by a female with no spouse present and 18.5 percent of those headed by a male with no spouse present fell below the poverty threshold. In contrast, 6 percent of rural families with a married couple were poor. On average, 11.6 percent of all rural families were poor. Poverty rates for single-adult families were higher than average for urban area residents as well in 2017, but overall family poverty rates were higher in rural than in urban areas. This chart appears in the ERS topic page for Rural Poverty & Well-being, updated March 2019.


