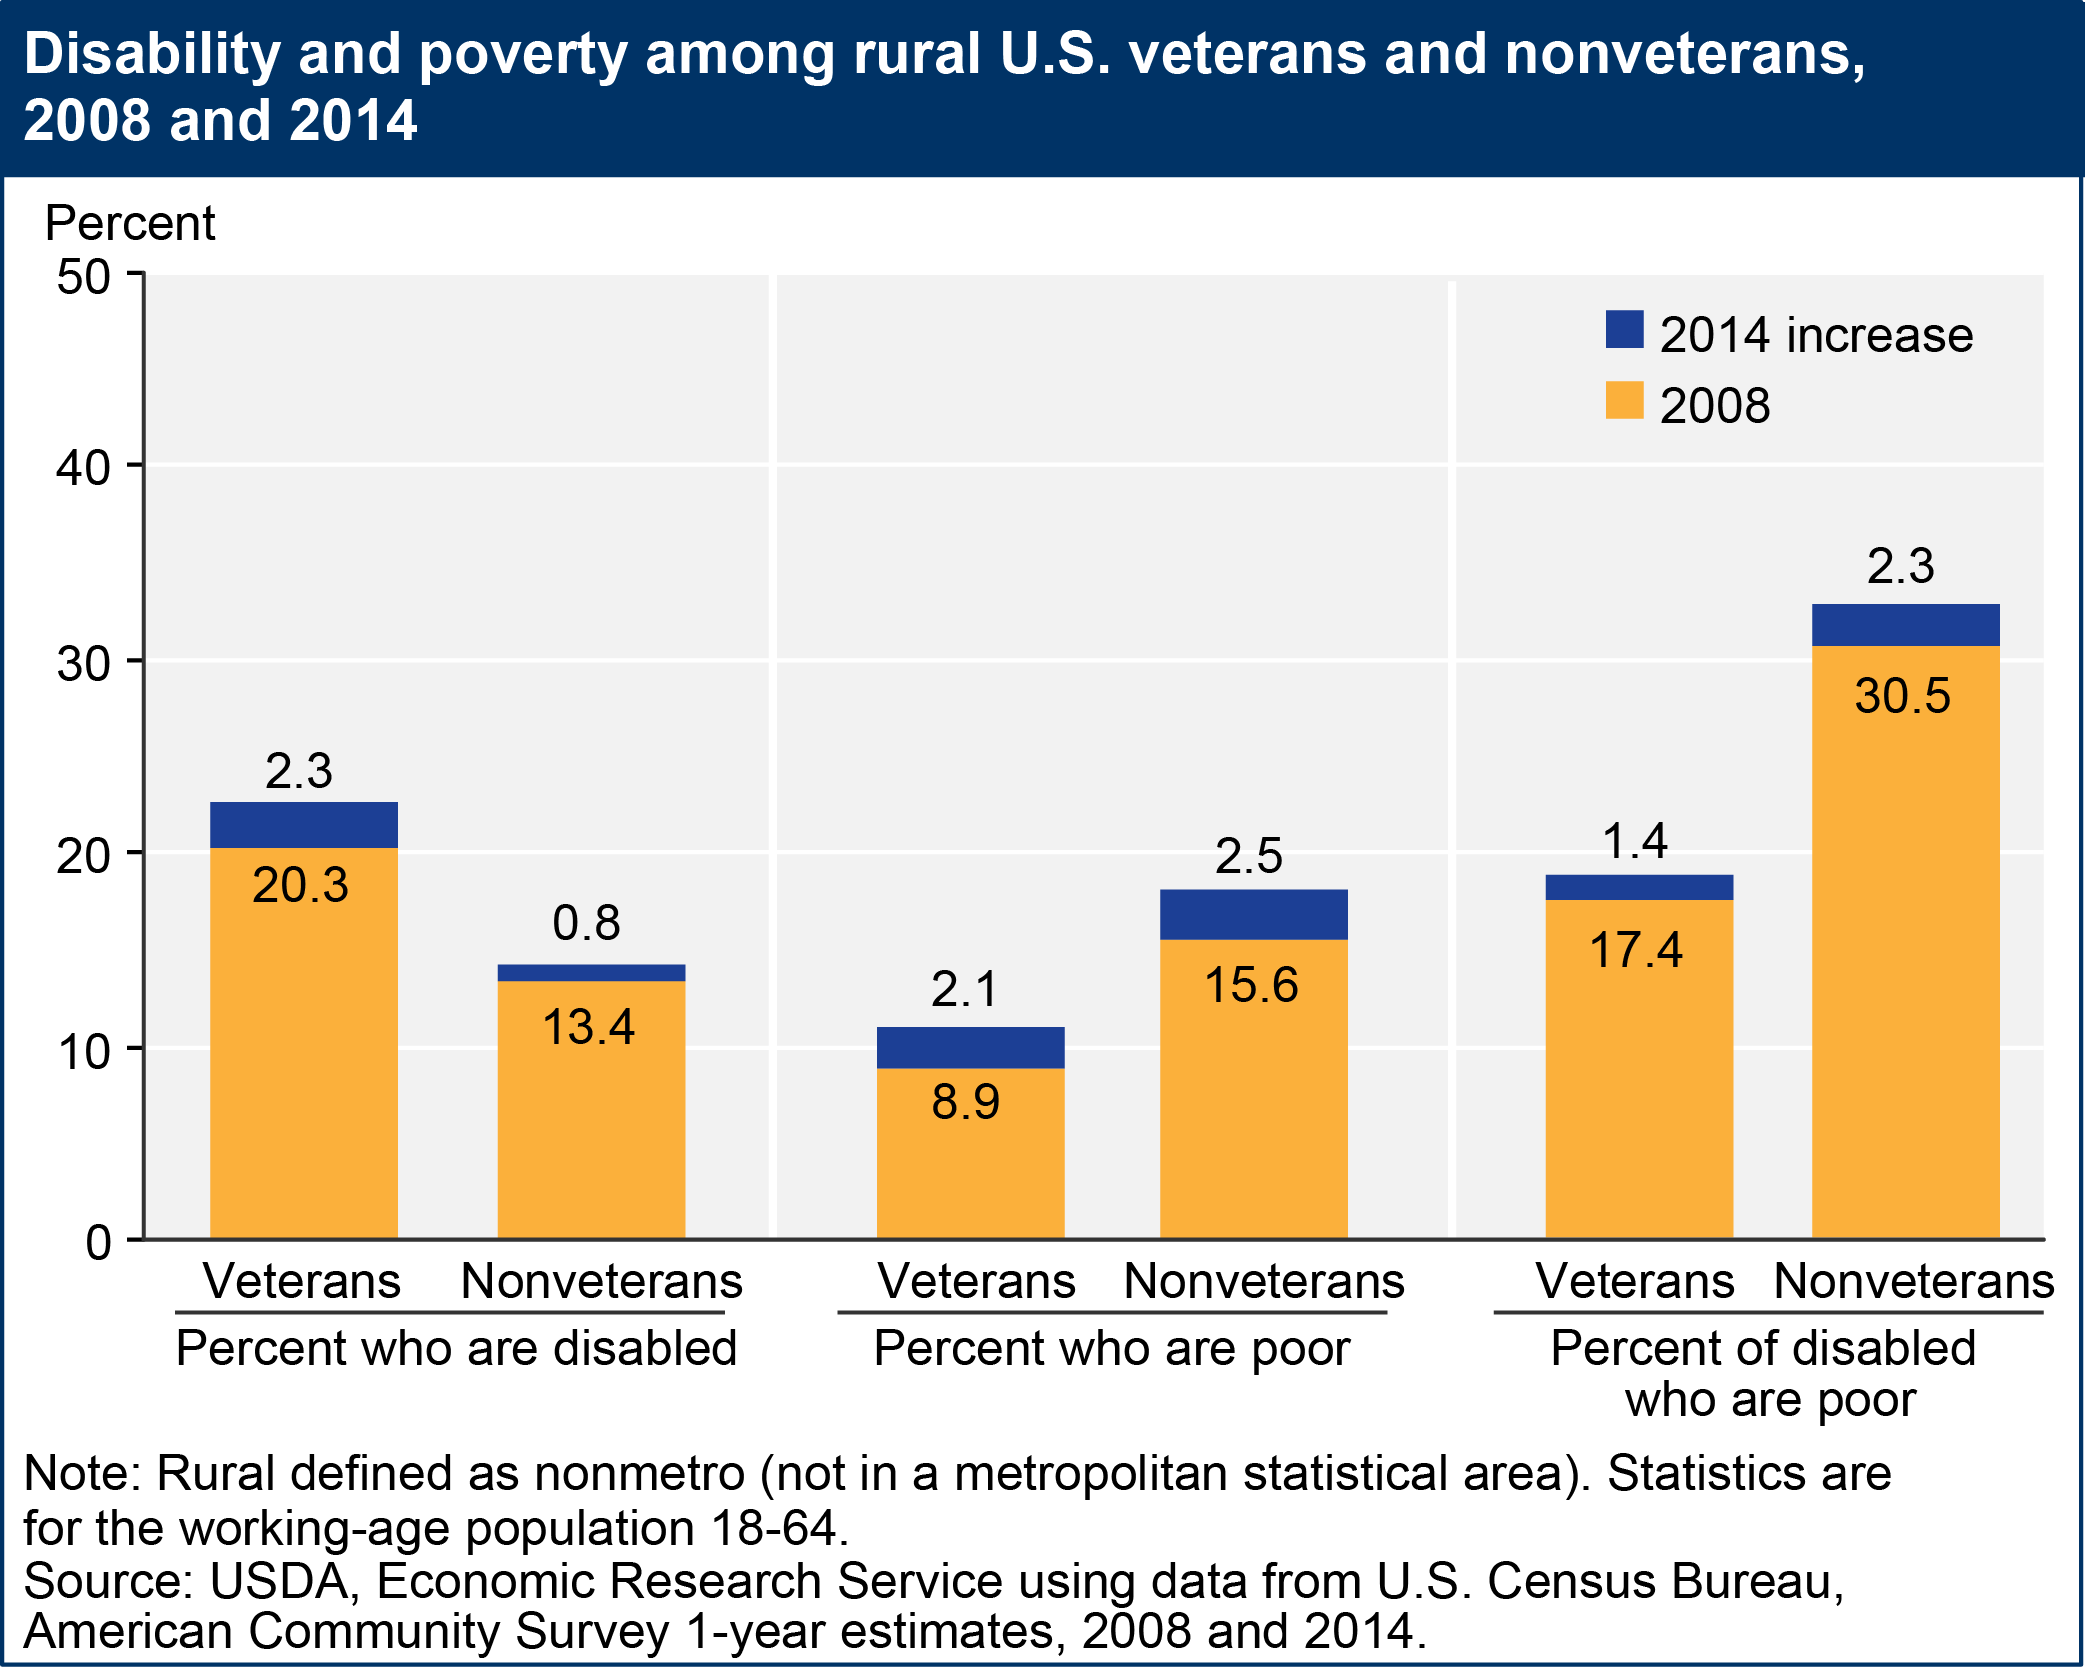
Disability and poverty rates among rural veterans have increased from 2008 to 2014
- by Tracey Farrigan
- 11/10/2015

In 2008, more than 2.4 million—8.2 percent—of the rural working-age population (18 to 64 years old) were veterans. That number declined to 1.5 million (5.9 percent) in 2014. During that period, however, the share of working-age rural veterans with a disability increased (from 20.3 percent to 22.6 percent), as did their poverty rate (from 8.9 percent to 11.0 percent). The disabled are more likely to live in poverty, particularly when the disability is work limiting, and veterans are more likely to report a work-limiting disability than comparable nonveterans. Limited labor force participation and economic constraints often persist for persons with disabilities; however, vocational services and policy initiatives aim to support work among them. Disabled working-age veterans were less likely to be in poverty (18.8 percent) than their nonveteran counterparts (32.8 percent) in 2014. This chart is based on data found in the Atlas of Rural and Small Town America.


