
Limited-service restaurants captured the largest share of food-away-from-home spending from 2019 to 2023
- by Wilson Sinclair and Eliana Zeballos
- 9/19/2024
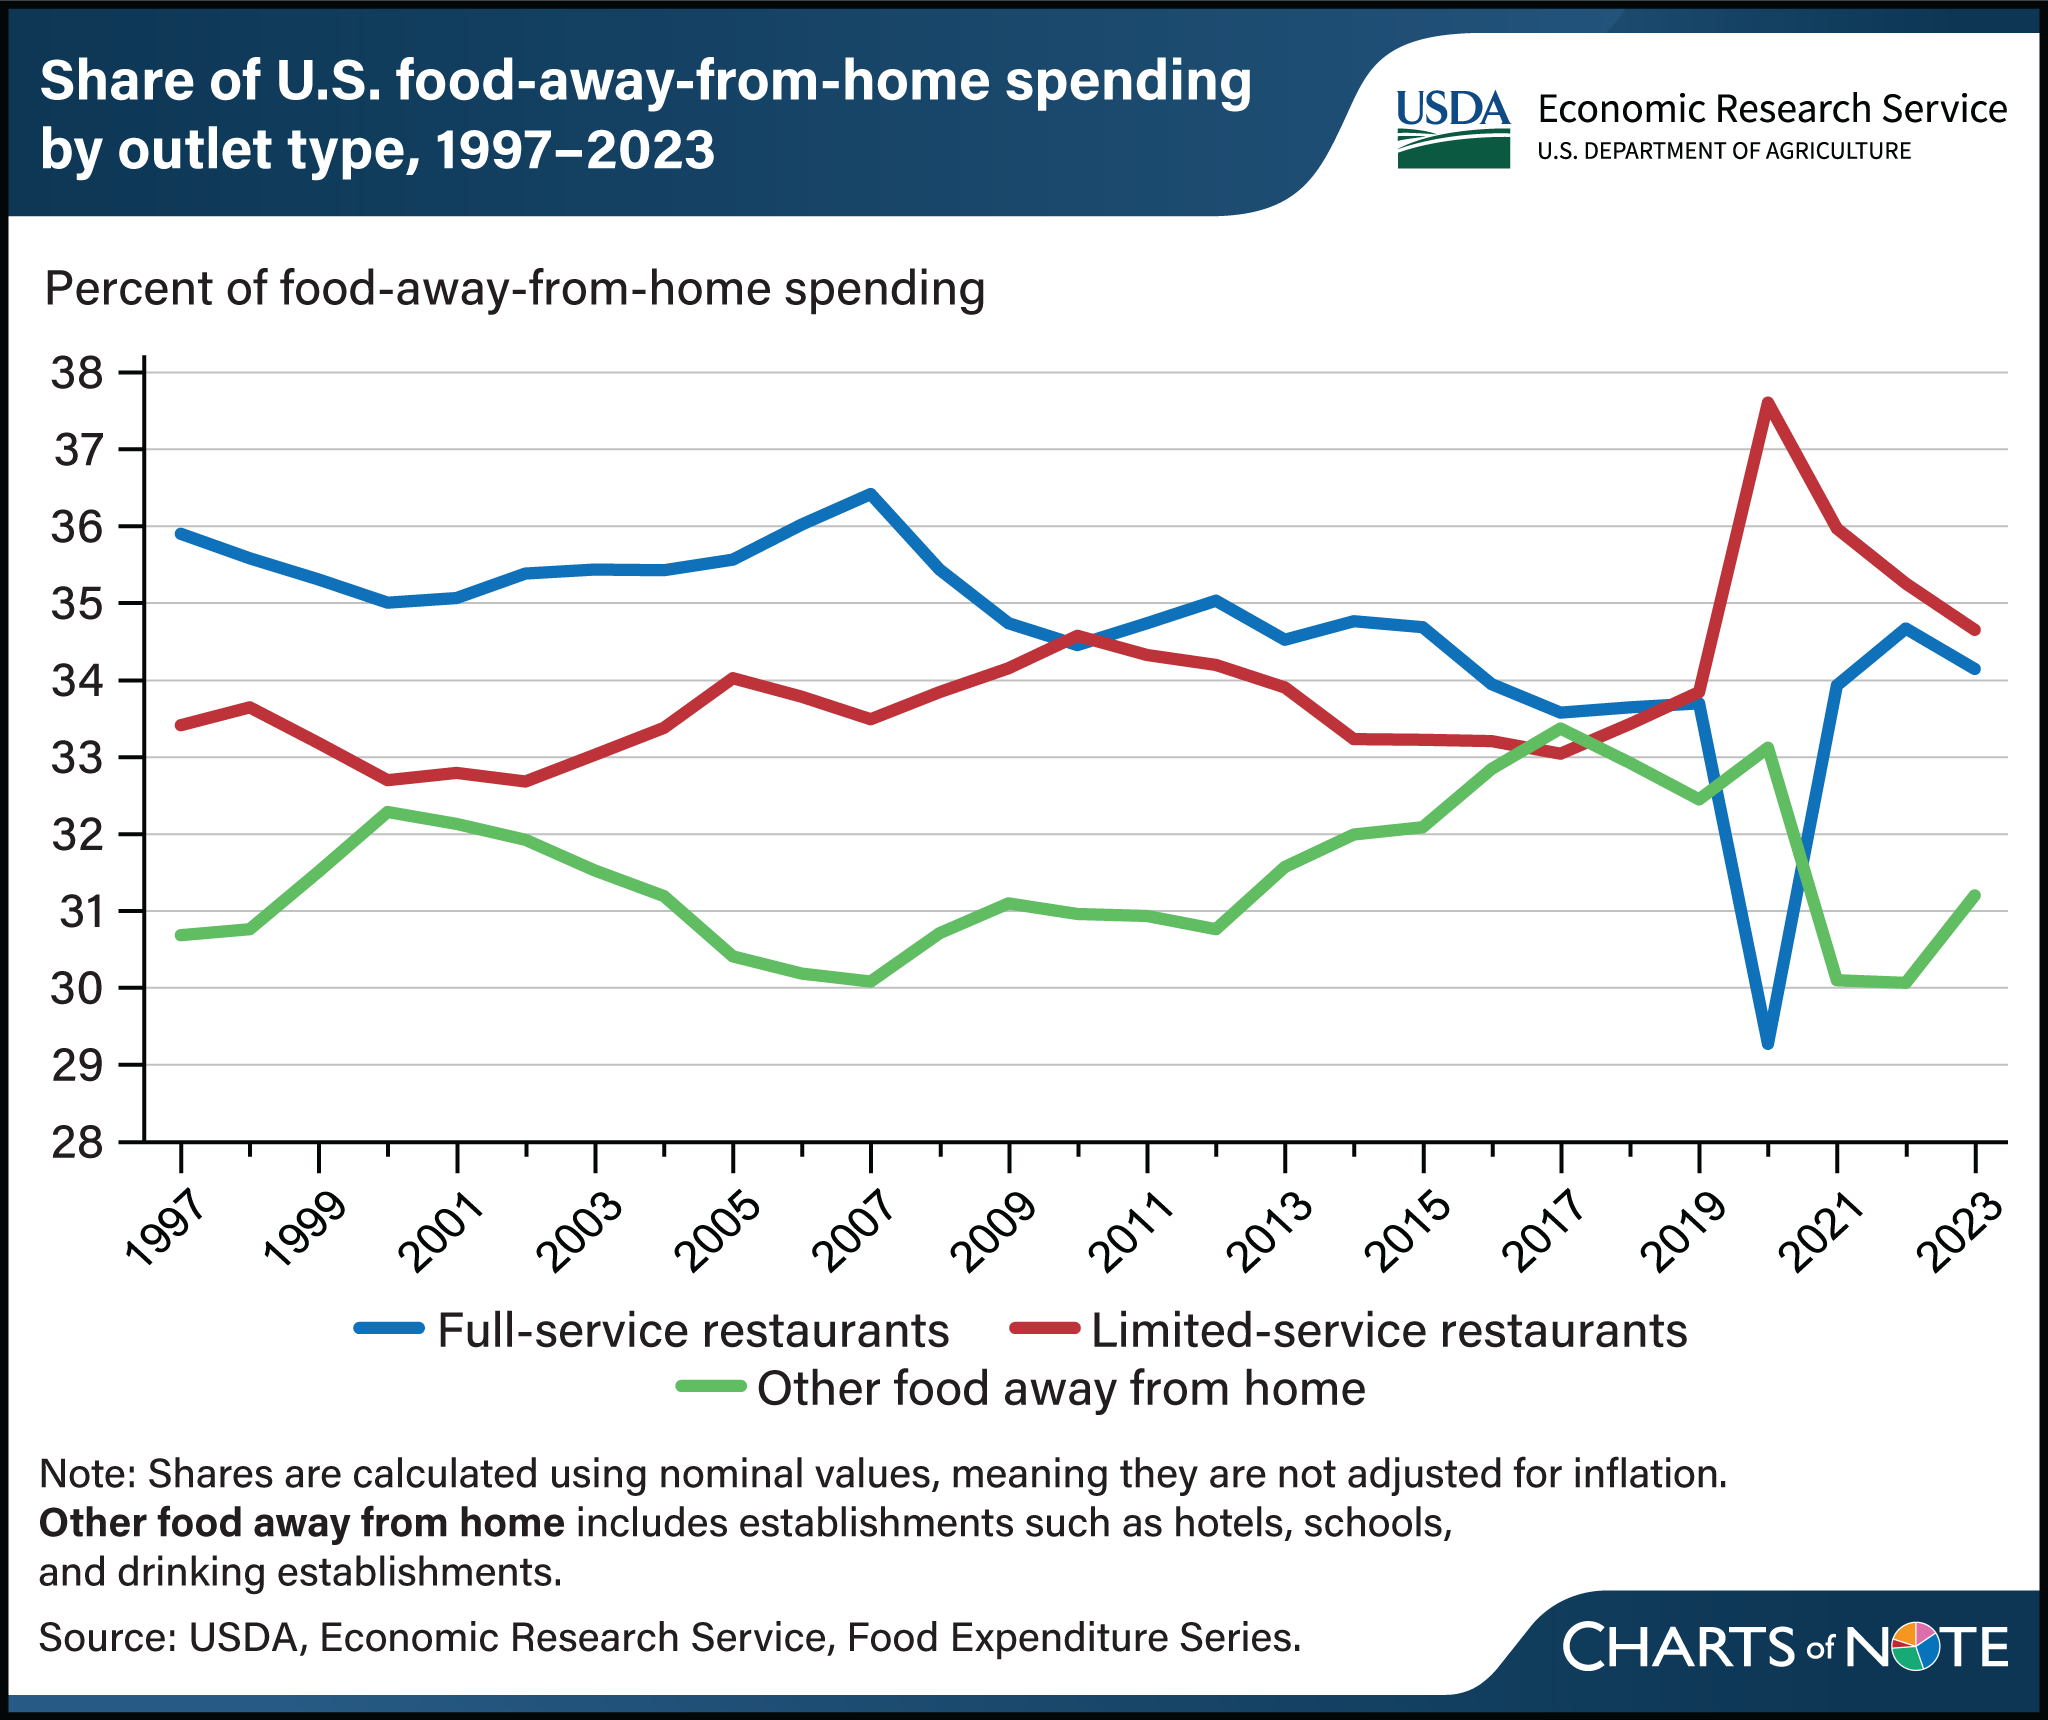
In 2023, full- and limited-service restaurants collectively accounted for more than two-thirds of U.S. food-away-from-home (FAFH) spending. Full-service establishments typically provide food services to customers who order and are served while seated and pay after eating, while in limited-service restaurants customers generally order and pay before eating and meals may be consumed on premises, taken out, or delivered to a specific location. Other FAFH outlets— hotels, schools, and drinking establishments, among others—accounted for the nearly remaining third of spending in 2023. In 1997, full-service restaurants received the largest share of food-away-from-home spending at 35.9 percent. However, that share began to decrease during the Great Recession (December 2007 to June 2009) and then sharply declined in early 2020 during the brief recession at the start of the Coronavirus (COVID-19) pandemic. Conversely, limited-service restaurant spending reached 34.6 percent in 2010, peaked at 37.6 percent in 2020, and received the largest share of food-away-from-home spending through 2023. The data for this chart come from the USDA, Economic Research Service’s Food Expenditure Series.