

U.S. consumers’ eating patterns differ from Federal recommendations
- by Biing-Hwan Lin and Joanne Guthrie
- 5/23/2023
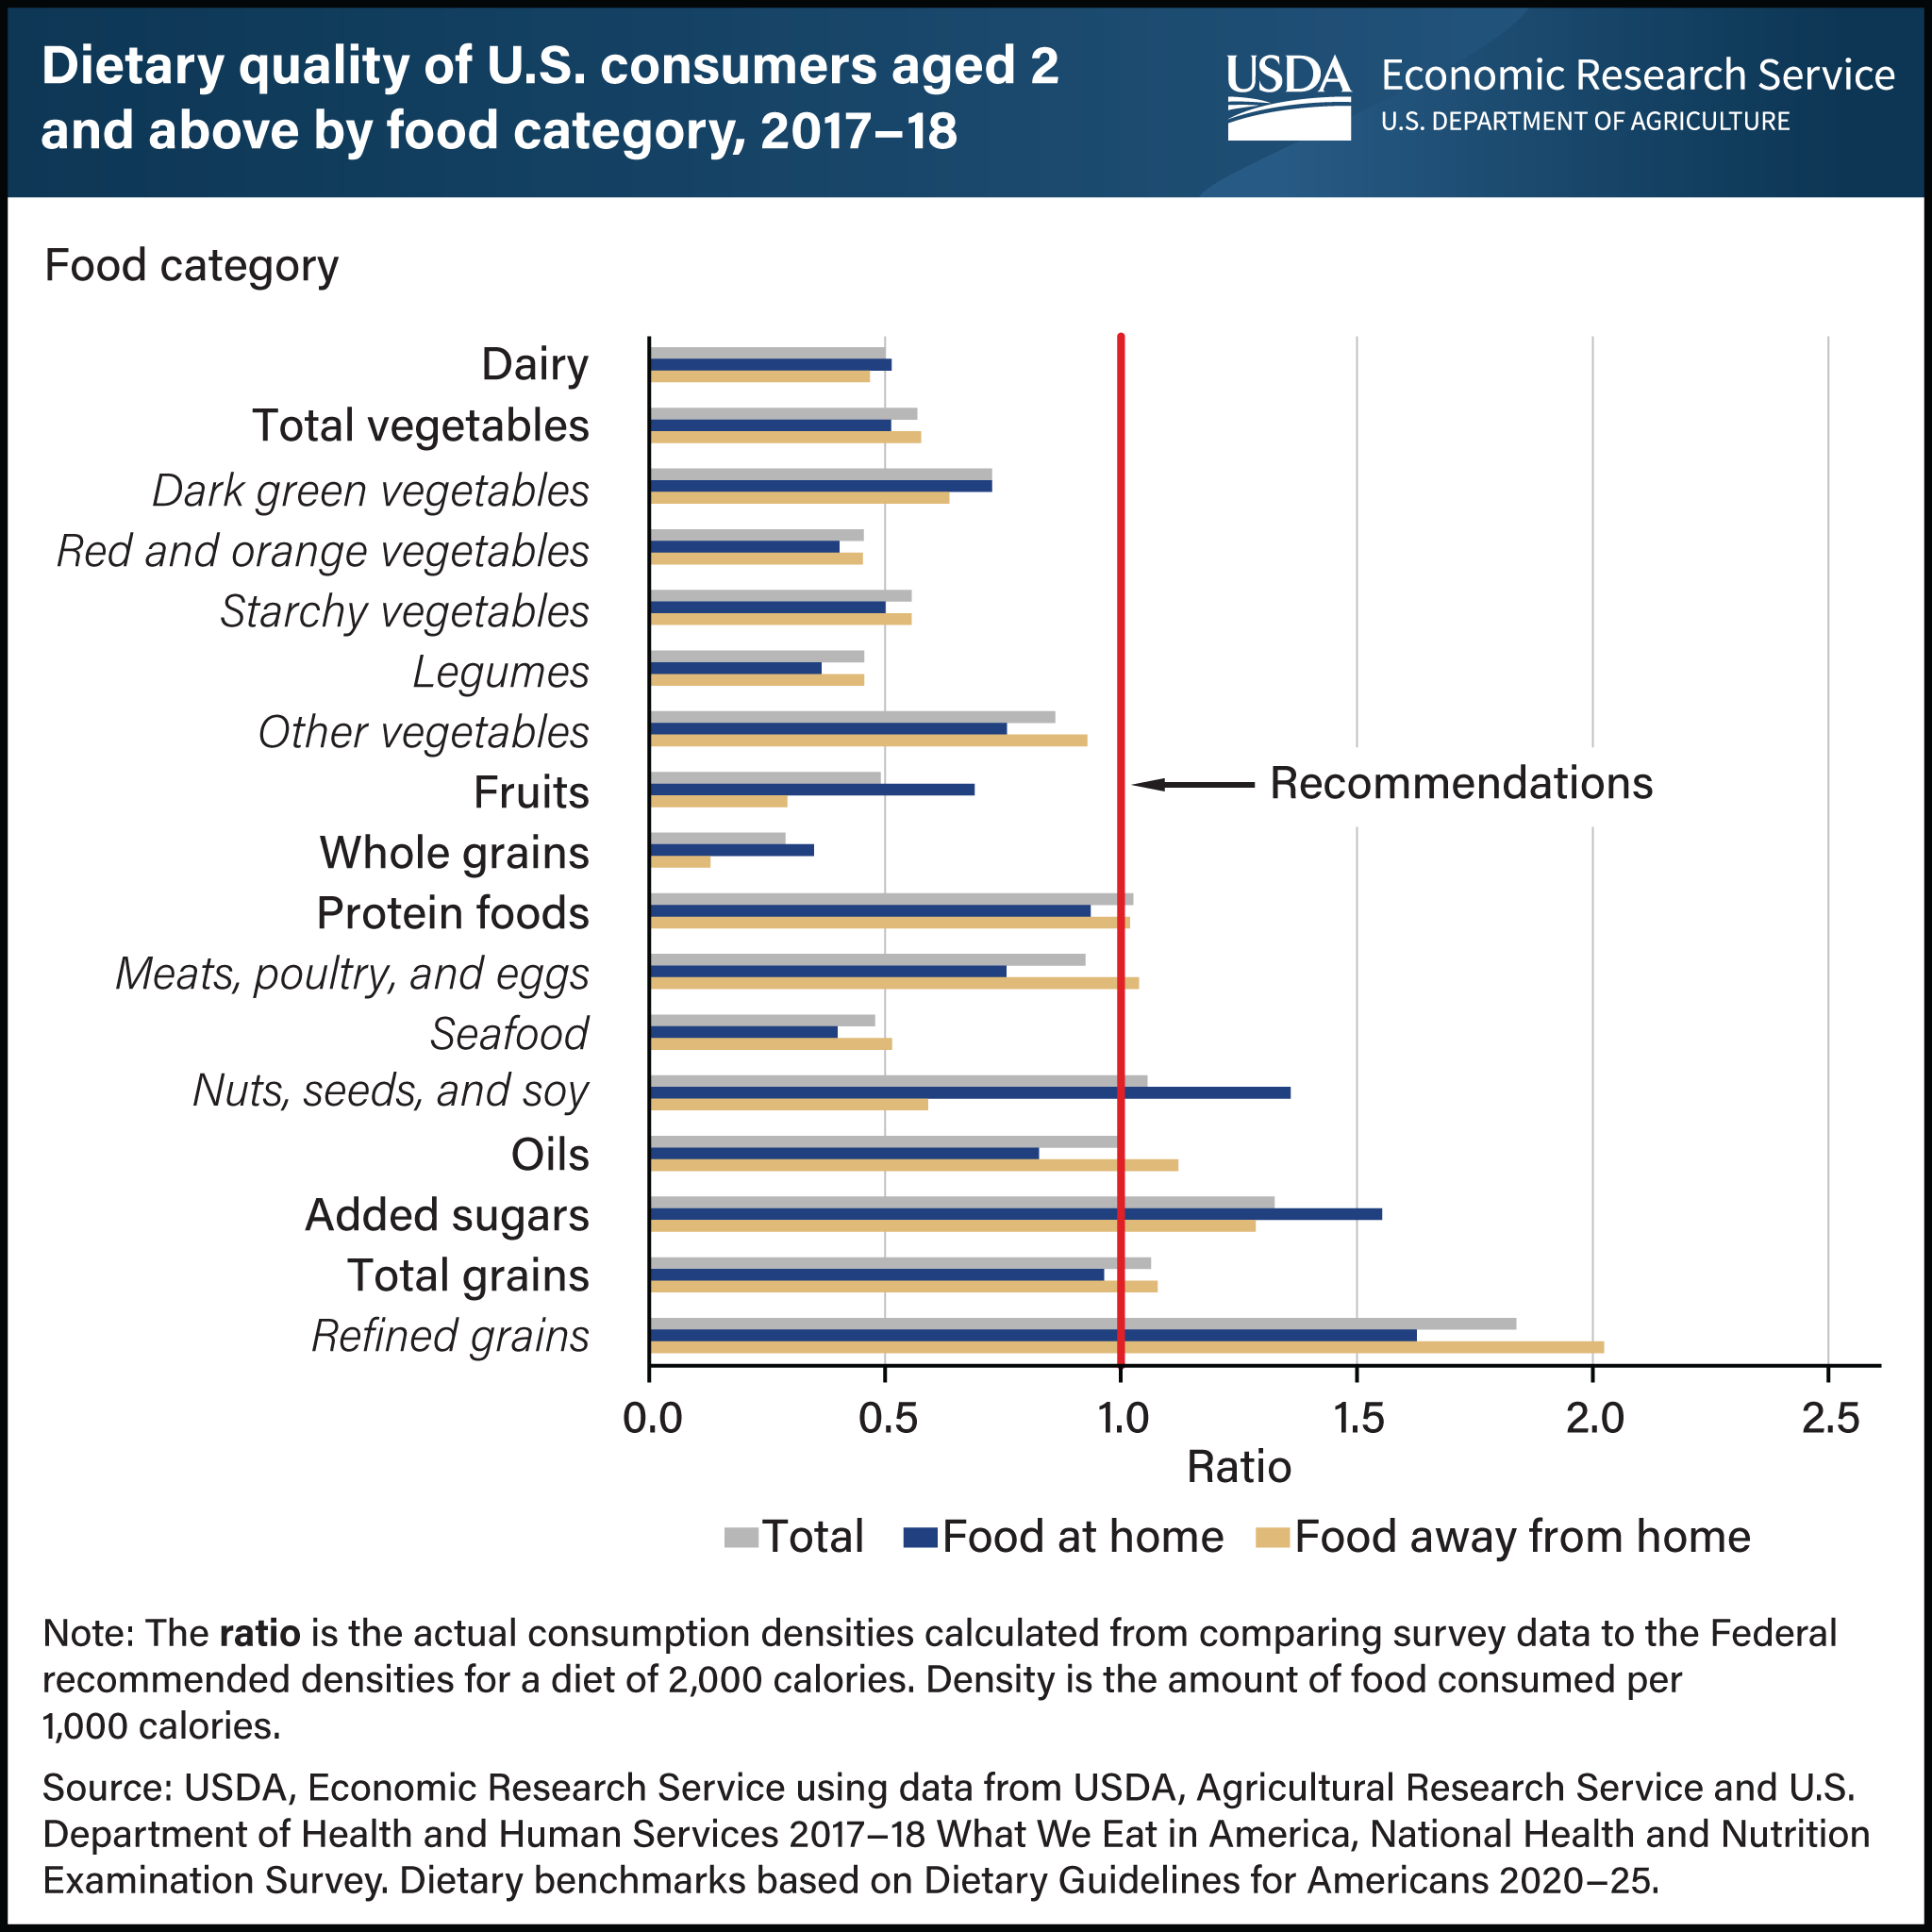
U.S. consumers’ eating patterns differ from Federal recommendations for many food categories, and where food is obtained plays a role. Researchers from USDA, Economic Research Service (ERS) and the University of Georgia examined diet patterns based on density—amounts of food consumed per 1,000 calories—using the latest available national food consumption survey data collected in 2017–18. They compared average consumption densities of 17 food categories with what would be needed to match the Dietary Guidelines for Americans recommendations, assuming a 2,000-calorie intake. Average total consumption densities for 11 food categories fell more than 20 percent outside of recommended levels, with whole grains more than 70 percent below the recommended amount. Refined grains, on the other hand, had a consumption density of more than 85 percent above the recommended level. Densities of 6 food categories were within 20 percent of the recommended range. Generally, food purchased at grocery stores, supermarkets, and similar retailers for home preparation had consumption densities more in line with dietary recommendations than food obtained from commercial away-from-home sources (primarily restaurants and fast food establishments). This chart is drawn from the ERS report Dietary Quality by Food Source and Demographics in the United States, 1977–2018, published March 2023.