

COVID-19 vaccination rates vary by metropolitan and persistent poverty status
- by Austin Sanders and Elizabeth A. Dobis
- 11/18/2021
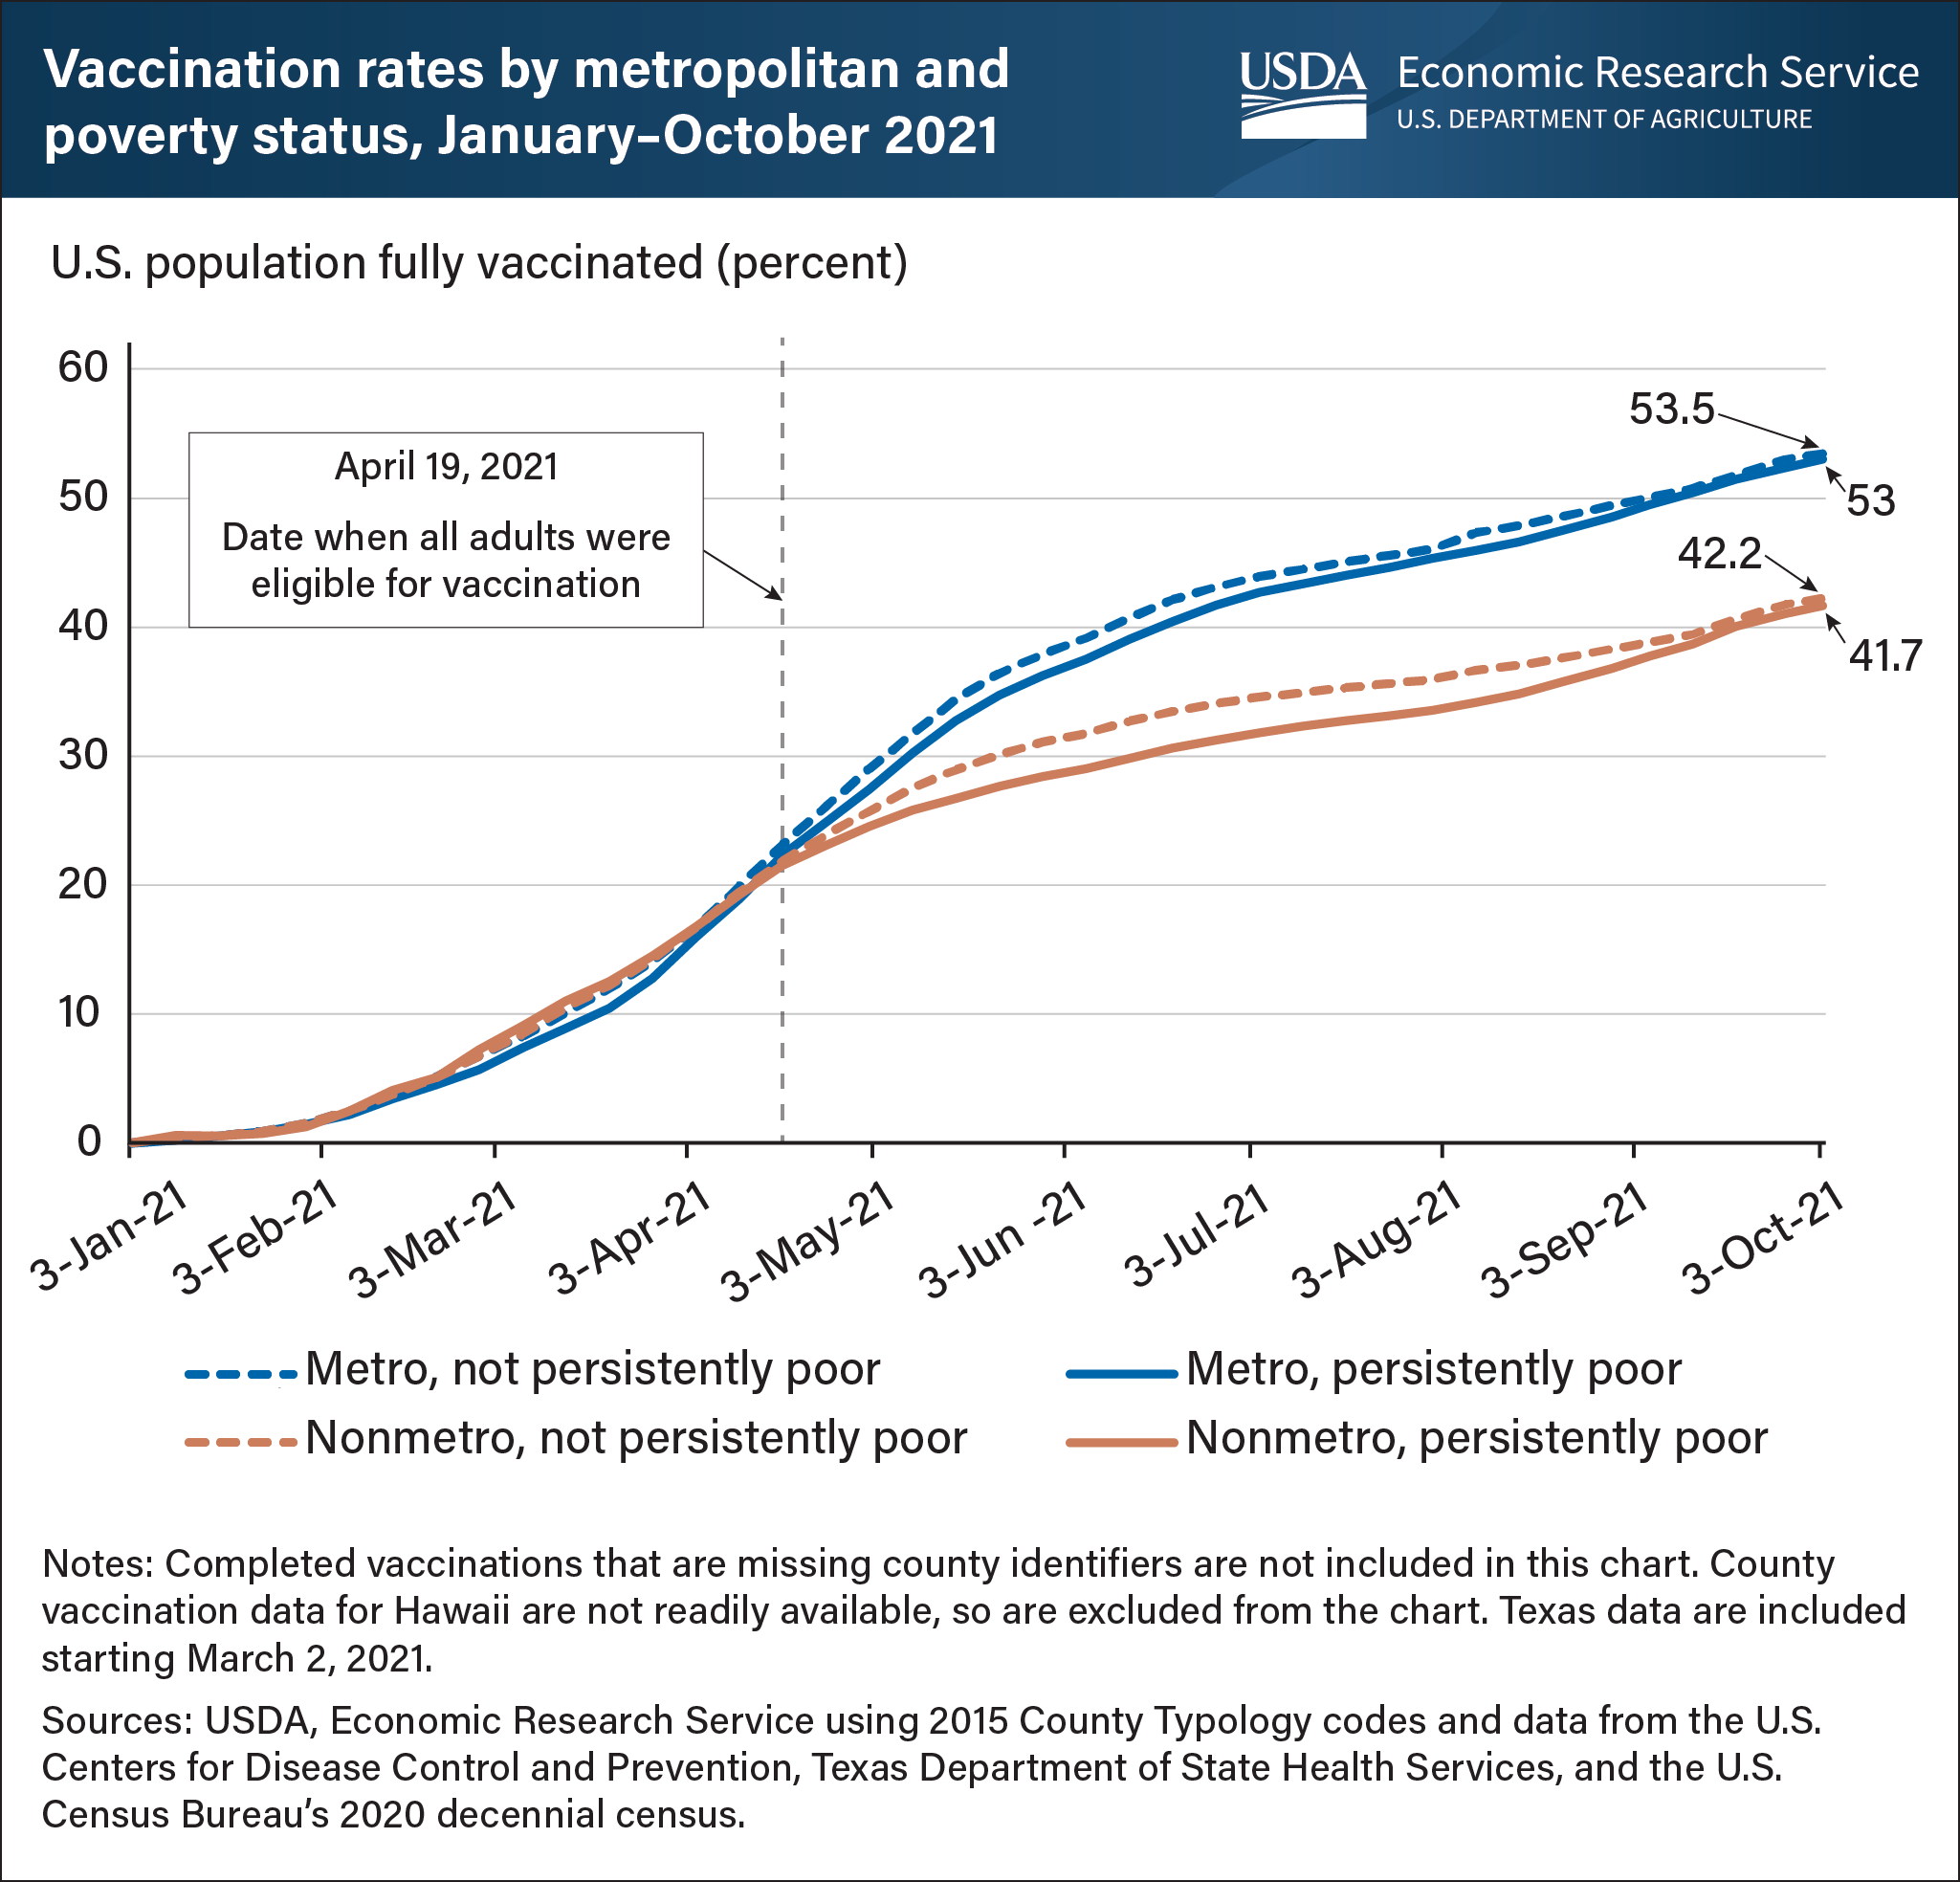
The public rollout of Coronavirus (COVID-19) vaccinations in the United States began in mid-December 2020. The early phases of vaccination prioritized frontline health care workers, adults age 65 and over, individuals with high-risk medical conditions, and essential workers. During this period, vaccination rates in metro (urban) and nonmetro (rural) counties increased at about the same rate, and by mid-April 2021, total vaccination rates for the Nation were slightly above 20 percent. After April 19, 2021, when all adults became eligible for vaccination, the share of fully vaccinated residents increased faster in metro counties than in nonmetro counties. In addition, the vaccination rate was consistently lower in persistently poor counties than in counties that were not persistently poor. Persistently poor counties are counties in which 20 percent or more of the population lived at or below the Federal poverty line during four consecutive U.S. census measurements dating to 1980. In July 2021, the highly infectious Delta variant began to spread. Rural persistently poor counties led the Nation in new infections through much of this surge, and the gap in vaccination rates between persistently poor and other counties started to close in mid-August. However, the rural-urban vaccination gap persisted. By early October 2021, the vaccination rate in urban counties had reached 53 percent, while the vaccination rate in rural counties was about 42 percent. This chart is included in the USDA Economic Research Service report Rural America at a Glance: 2021 Edition, published November 17, 2021.