
Apples and oranges remain the top U.S. fruit choices
- by Andrzej Blazejczyk
- 8/30/2021
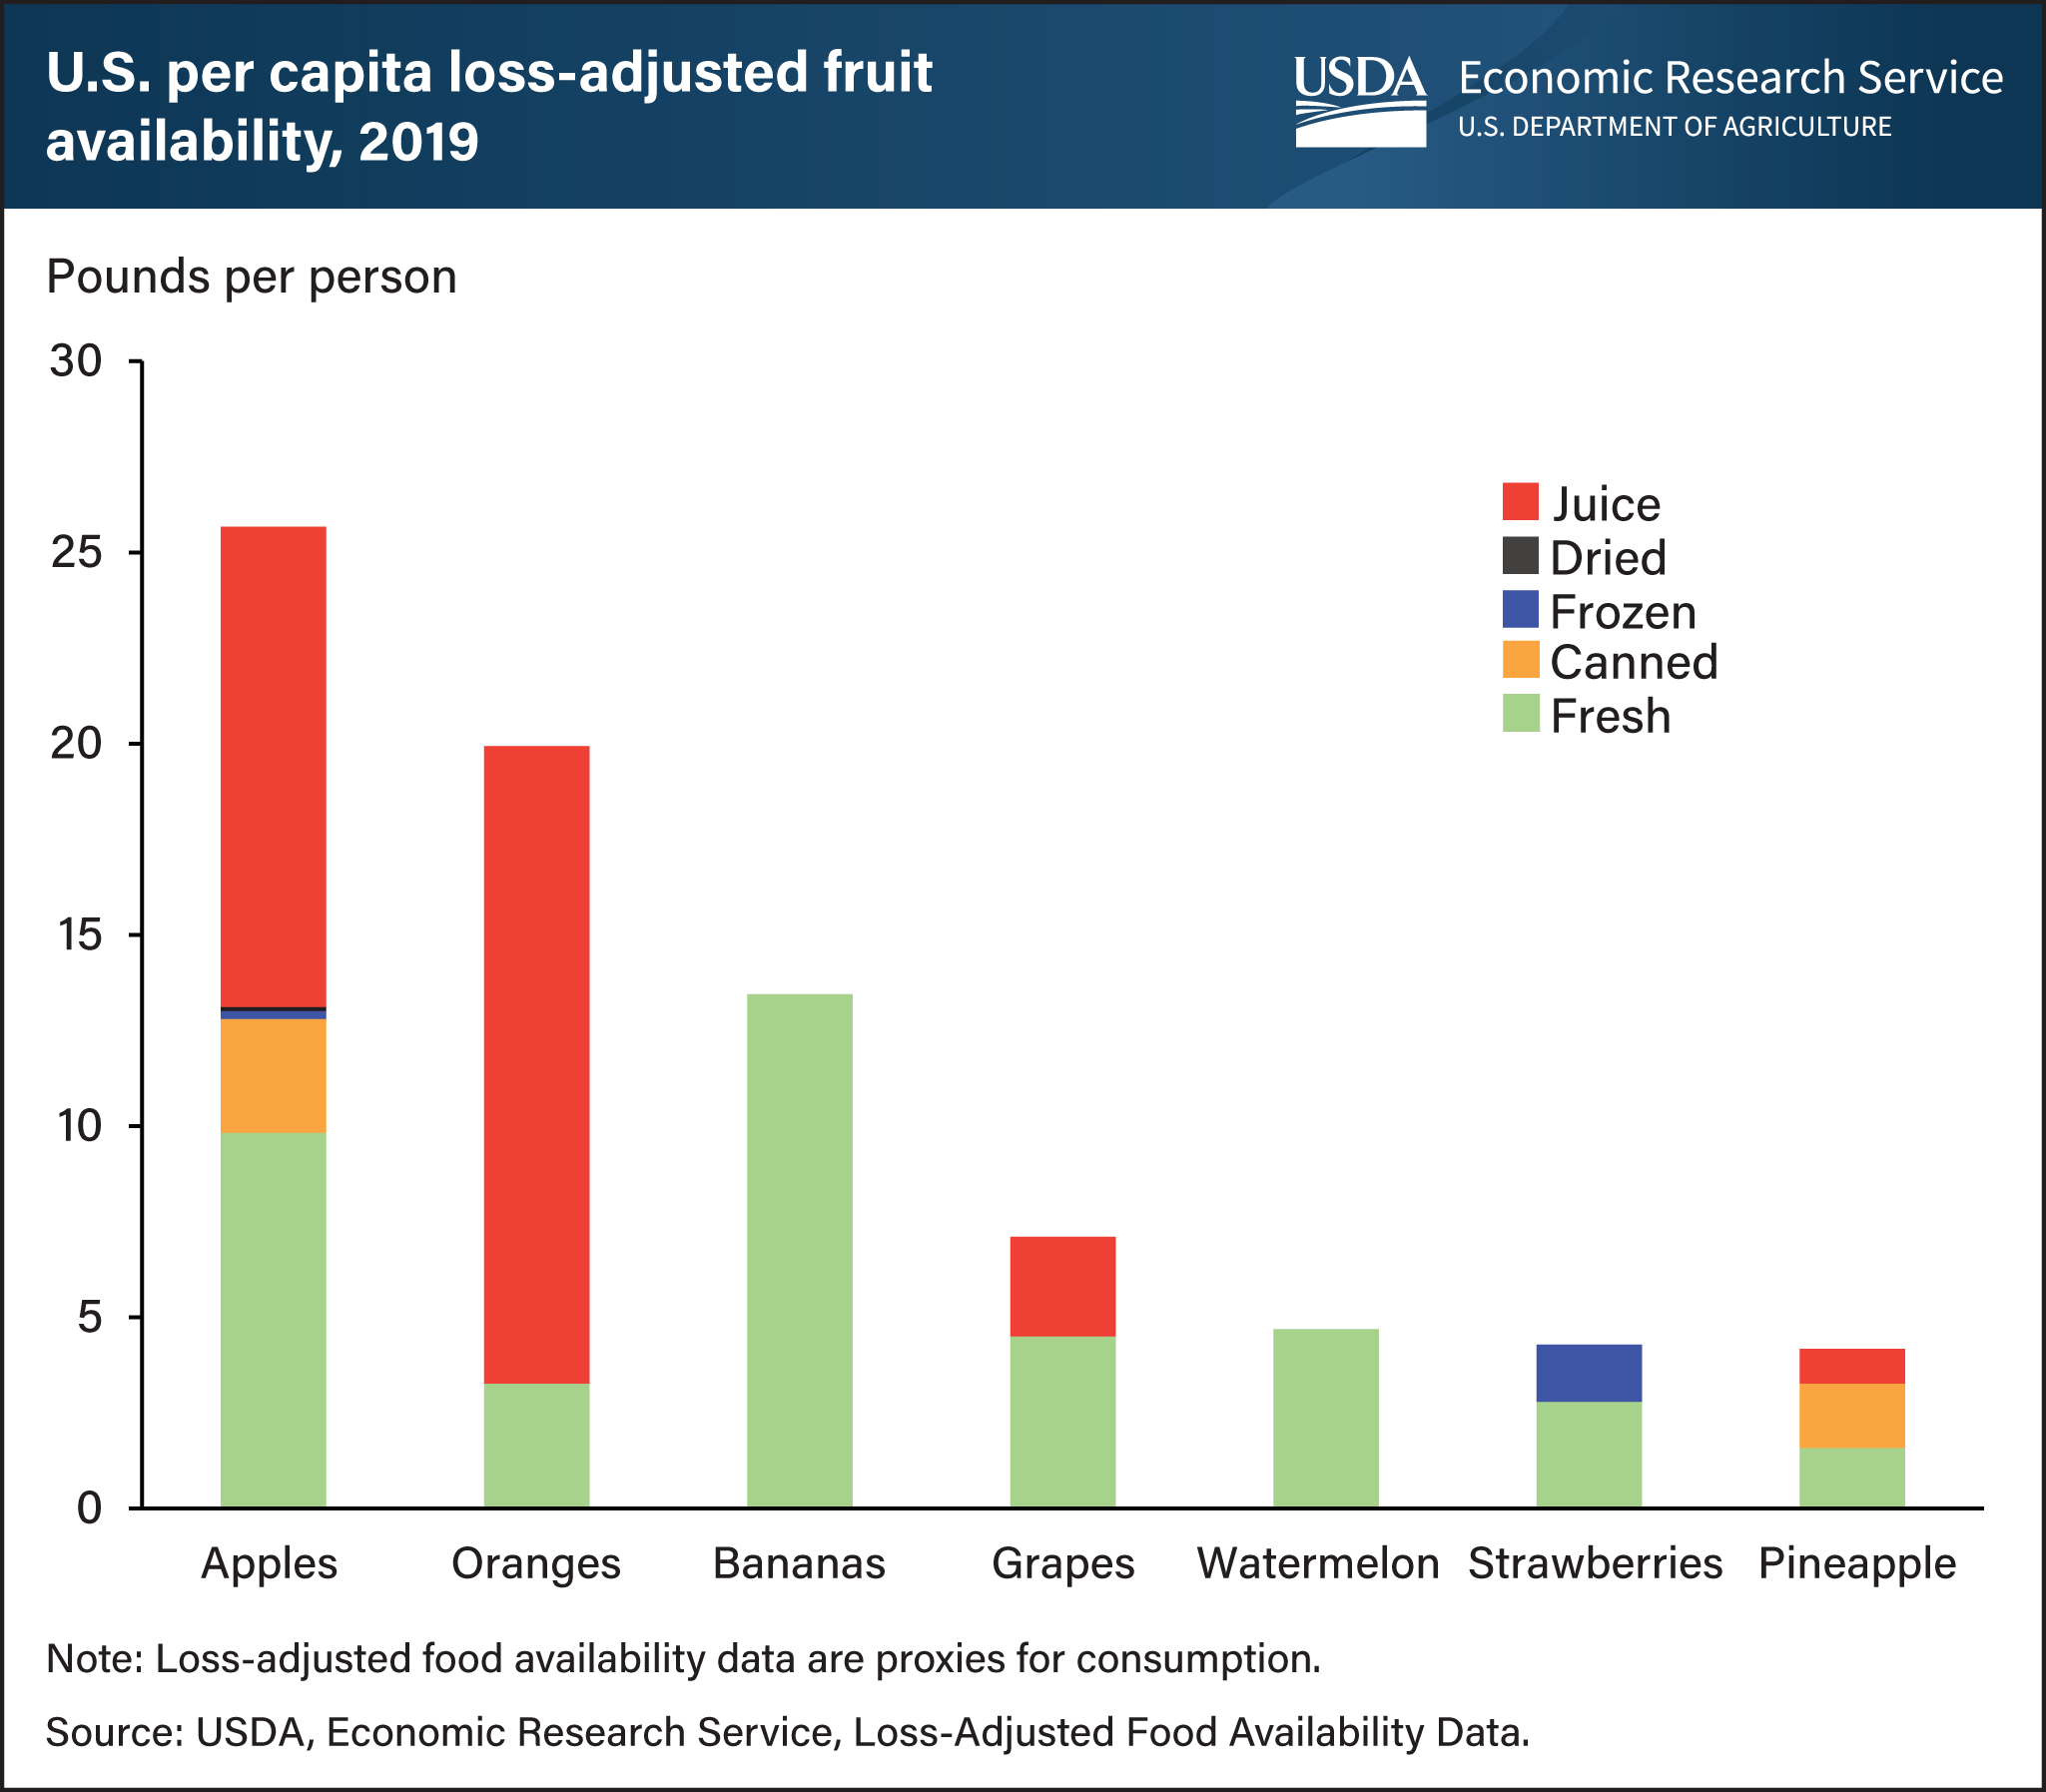
Apples held the top spot for total fruit available for consumption in 2019 at more than 25 pounds per person after adjusting for losses. The USDA, Economic Research Service’s (ERS) loss-adjusted food availability data are derived from food availability data by adjusting for food spoilage, plate waste, and other losses to more closely approximate actual consumption. According to recently released estimates, people in the United States consumed an average of 12.6 pounds (equivalent to 1.4 gallons) of apple juice, roughly 10 pounds of fresh apples, and a total of 3.3 pounds of canned, dried, and frozen apples in 2019. Among the top seven consumed fruits in 2019, apples were the only fruit available in all five forms: fresh, canned, frozen, dried, and juice. Pineapples were the only other canned option among these seven fruits, while strawberries were the only other frozen fruit available. Bananas (13.4 pounds per person) topped the list of most popular fresh fruits, while orange juice (16.7 pounds or 1.9 gallons) remained America’s favorite fruit juice. The data for this chart come from the Loss-Adjusted Food Availability data series in the ERS Food Availability (Per Capita) Data System, updated July 21, 2021.
We’d welcome your feedback!
Would you be willing to answer a few quick questions about your experience?