

SNAP and P-EBT accounted for more than one-ninth of total food-at-home spending from April to September 2020
- by Jordan W. Jones
- 6/7/2021
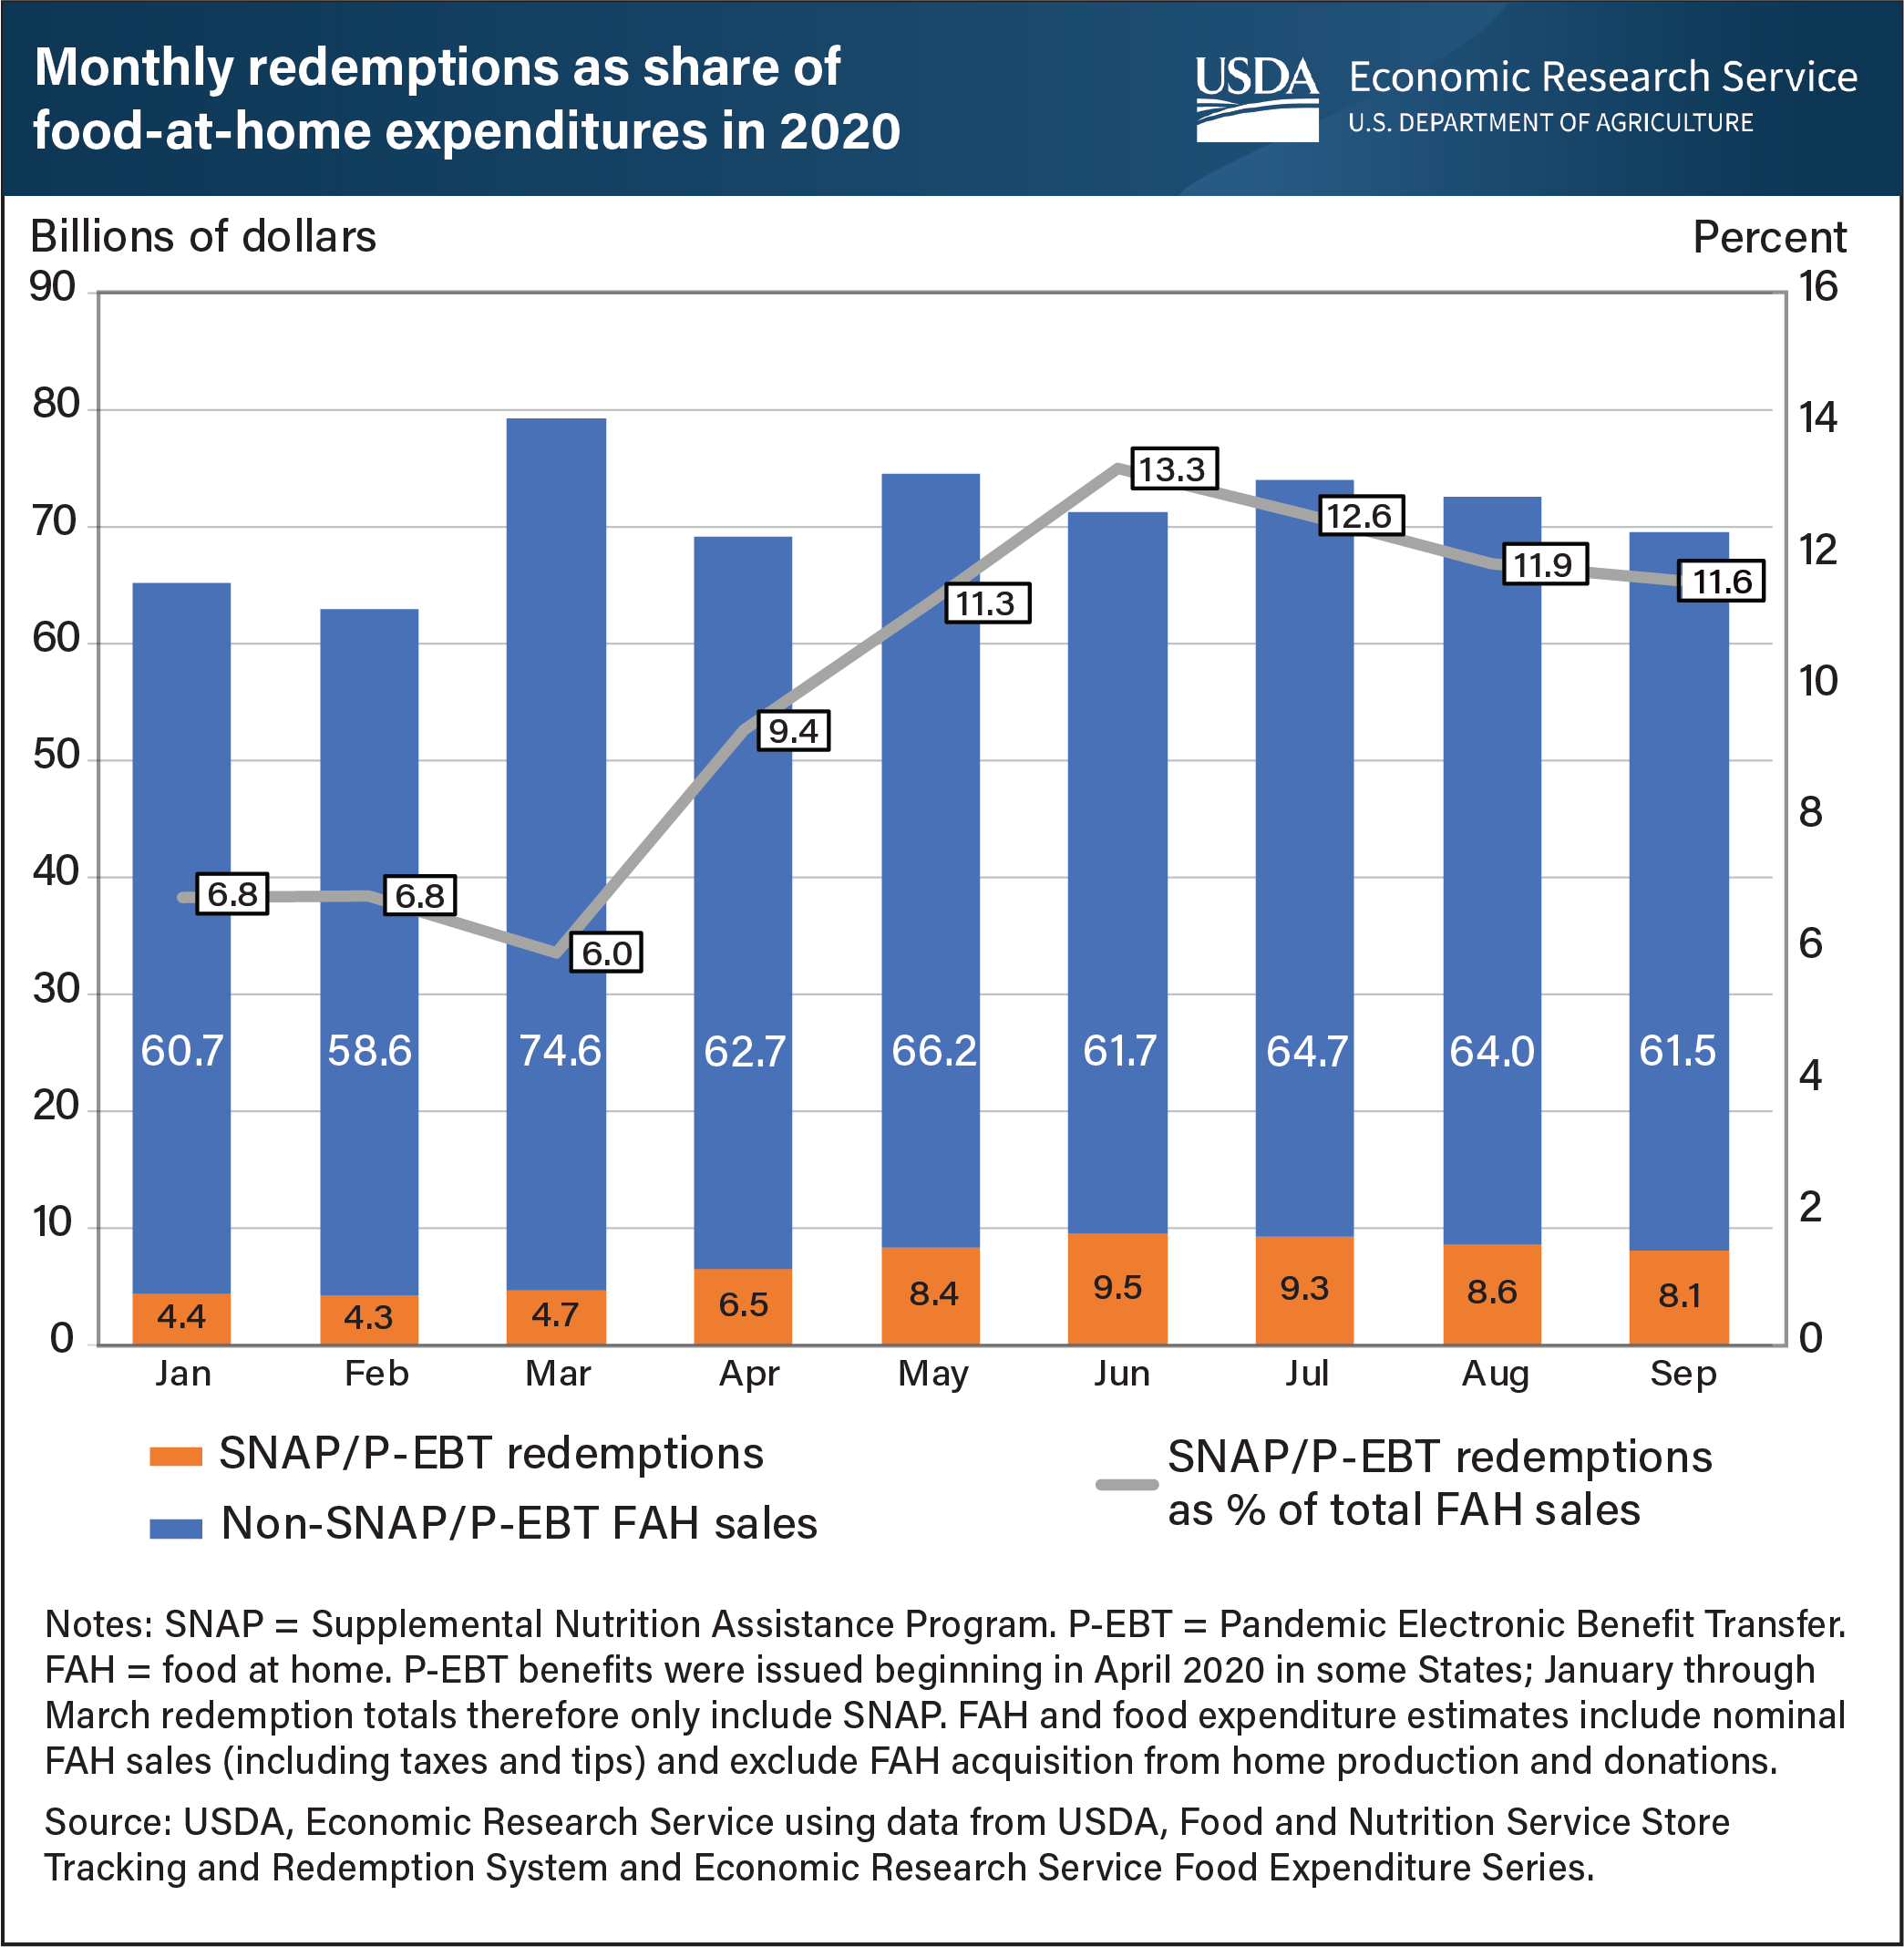
Shutdowns, stay-at-home orders, and the need for social distancing led households to buy more food for consumption at home during the Coronavirus (COVID-19) pandemic. In response to the economic downturn and pandemic conditions, supplemental emergency allotments were issued to Supplemental Nutrition Assistance Program (SNAP) households and Pandemic Electronic Benefit Transfer (P-EBT) benefits were distributed to households with children missing free and reduced-price school meals. This expansion of nutrition assistance led to a rapid increase in the dollar amount of these benefits issued to households and redeemed for food at home (FAH). In January and February 2020, SNAP benefit redemptions accounted for 6.8 percent of total FAH expenditures as estimated by the Food Expenditure Series. In March 2020, FAH spending spiked, causing SNAP’s share of FAH spending to fall. From March to June 2020, the introduction of P-EBT and increase in SNAP benefits led to rapid growth in these programs’ share of FAH spending. In June 2020, redemptions of these benefits peaked at $9.5 billion—making up 13.3 percent of FAH spending that month. This share fell the following three months. Overall, the share of total FAH spending attributable to SNAP and P-EBT from April through September 2020 was 11.7 percent—more than one in nine dollars and nearly 5 percentage points higher than SNAP’s share over the same months in 2019. This chart is based on a chart in the USDA, Economic Research Service’s COVID-19 Working Paper: Supplemental Nutrition Assistance Program and Pandemic Electronic Benefit Transfer Redemptions during the Coronavirus Pandemic, released March 2021.