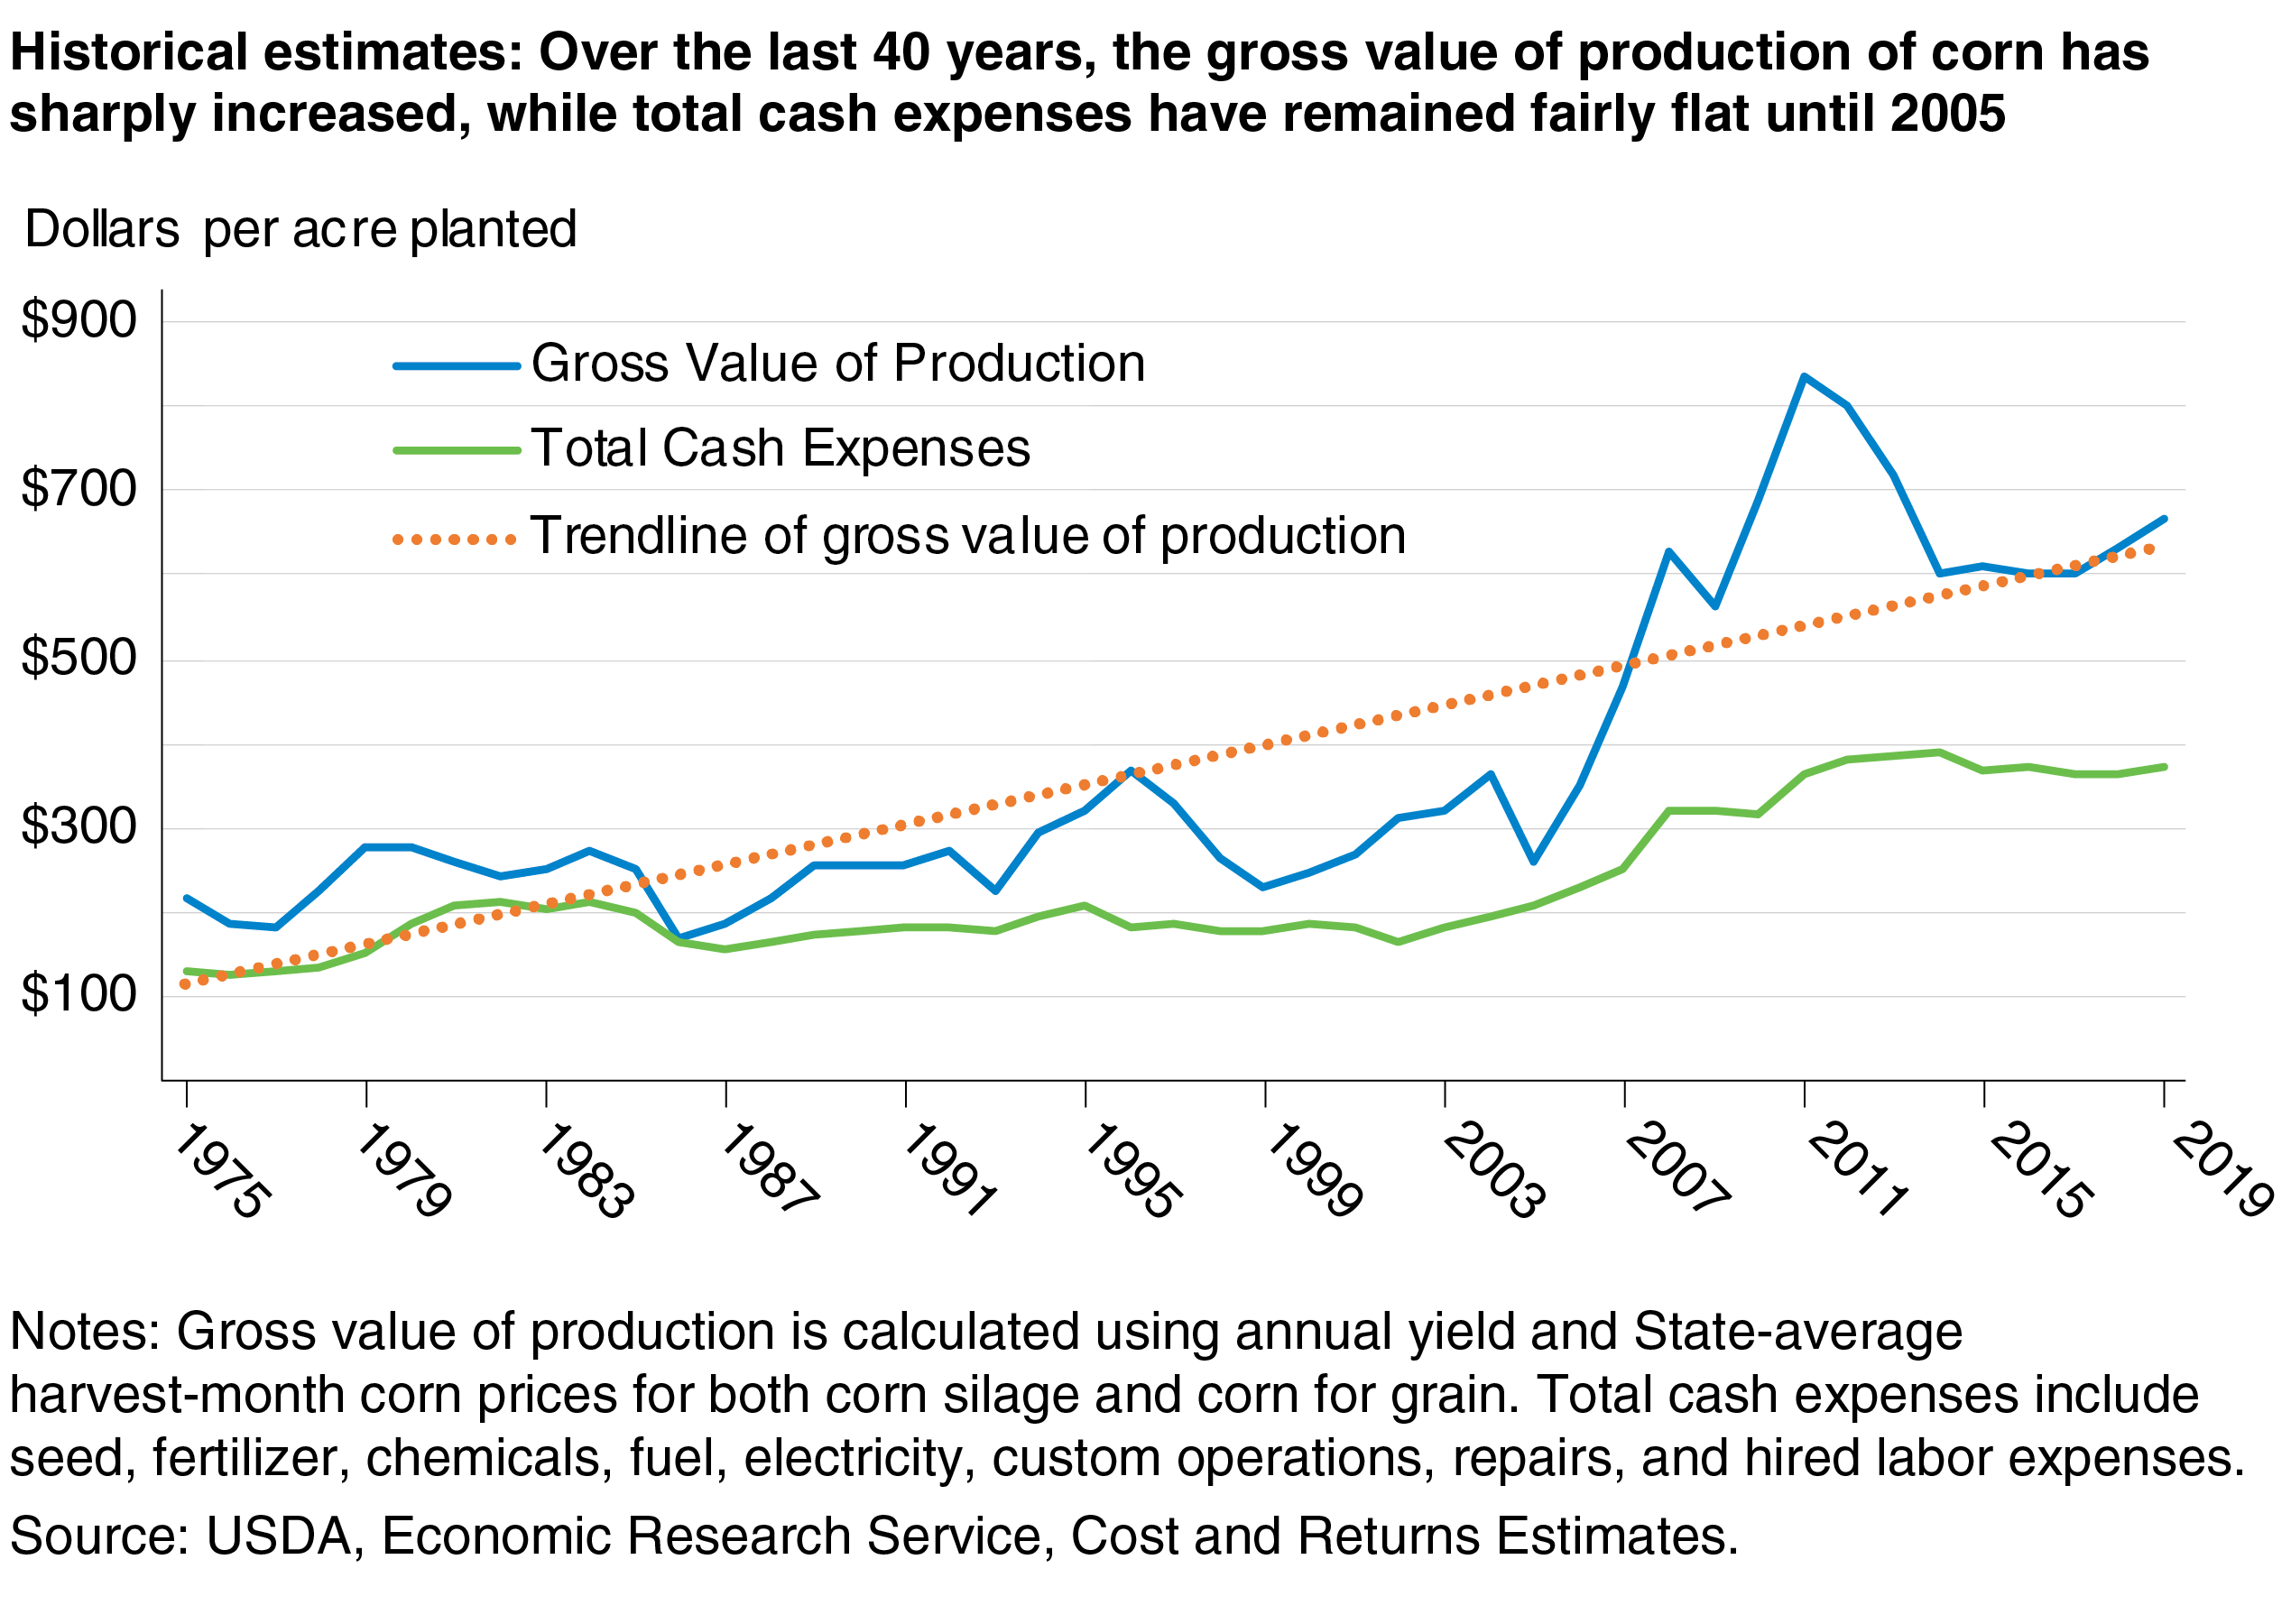
Historical estimates: Over the last 40 years, the gross value of production of corn has sharply increased, while total cash expenses have remained fairly flat until 2005
- by Samantha Padilla
- 12/2/2020

A line graph that shows the gross value of production and cash expenses for a commodity (corn) over the last 45 years, illustrating more variation in the value of production of corn than in expenses.
We’d welcome your feedback!
Would you be willing to answer a few quick questions about your experience?
