
Share of disposable personal income spent on food at home has fallen over time, while the share spent on food away from home has risen
- by Eliana Zeballos
- 10/28/2020
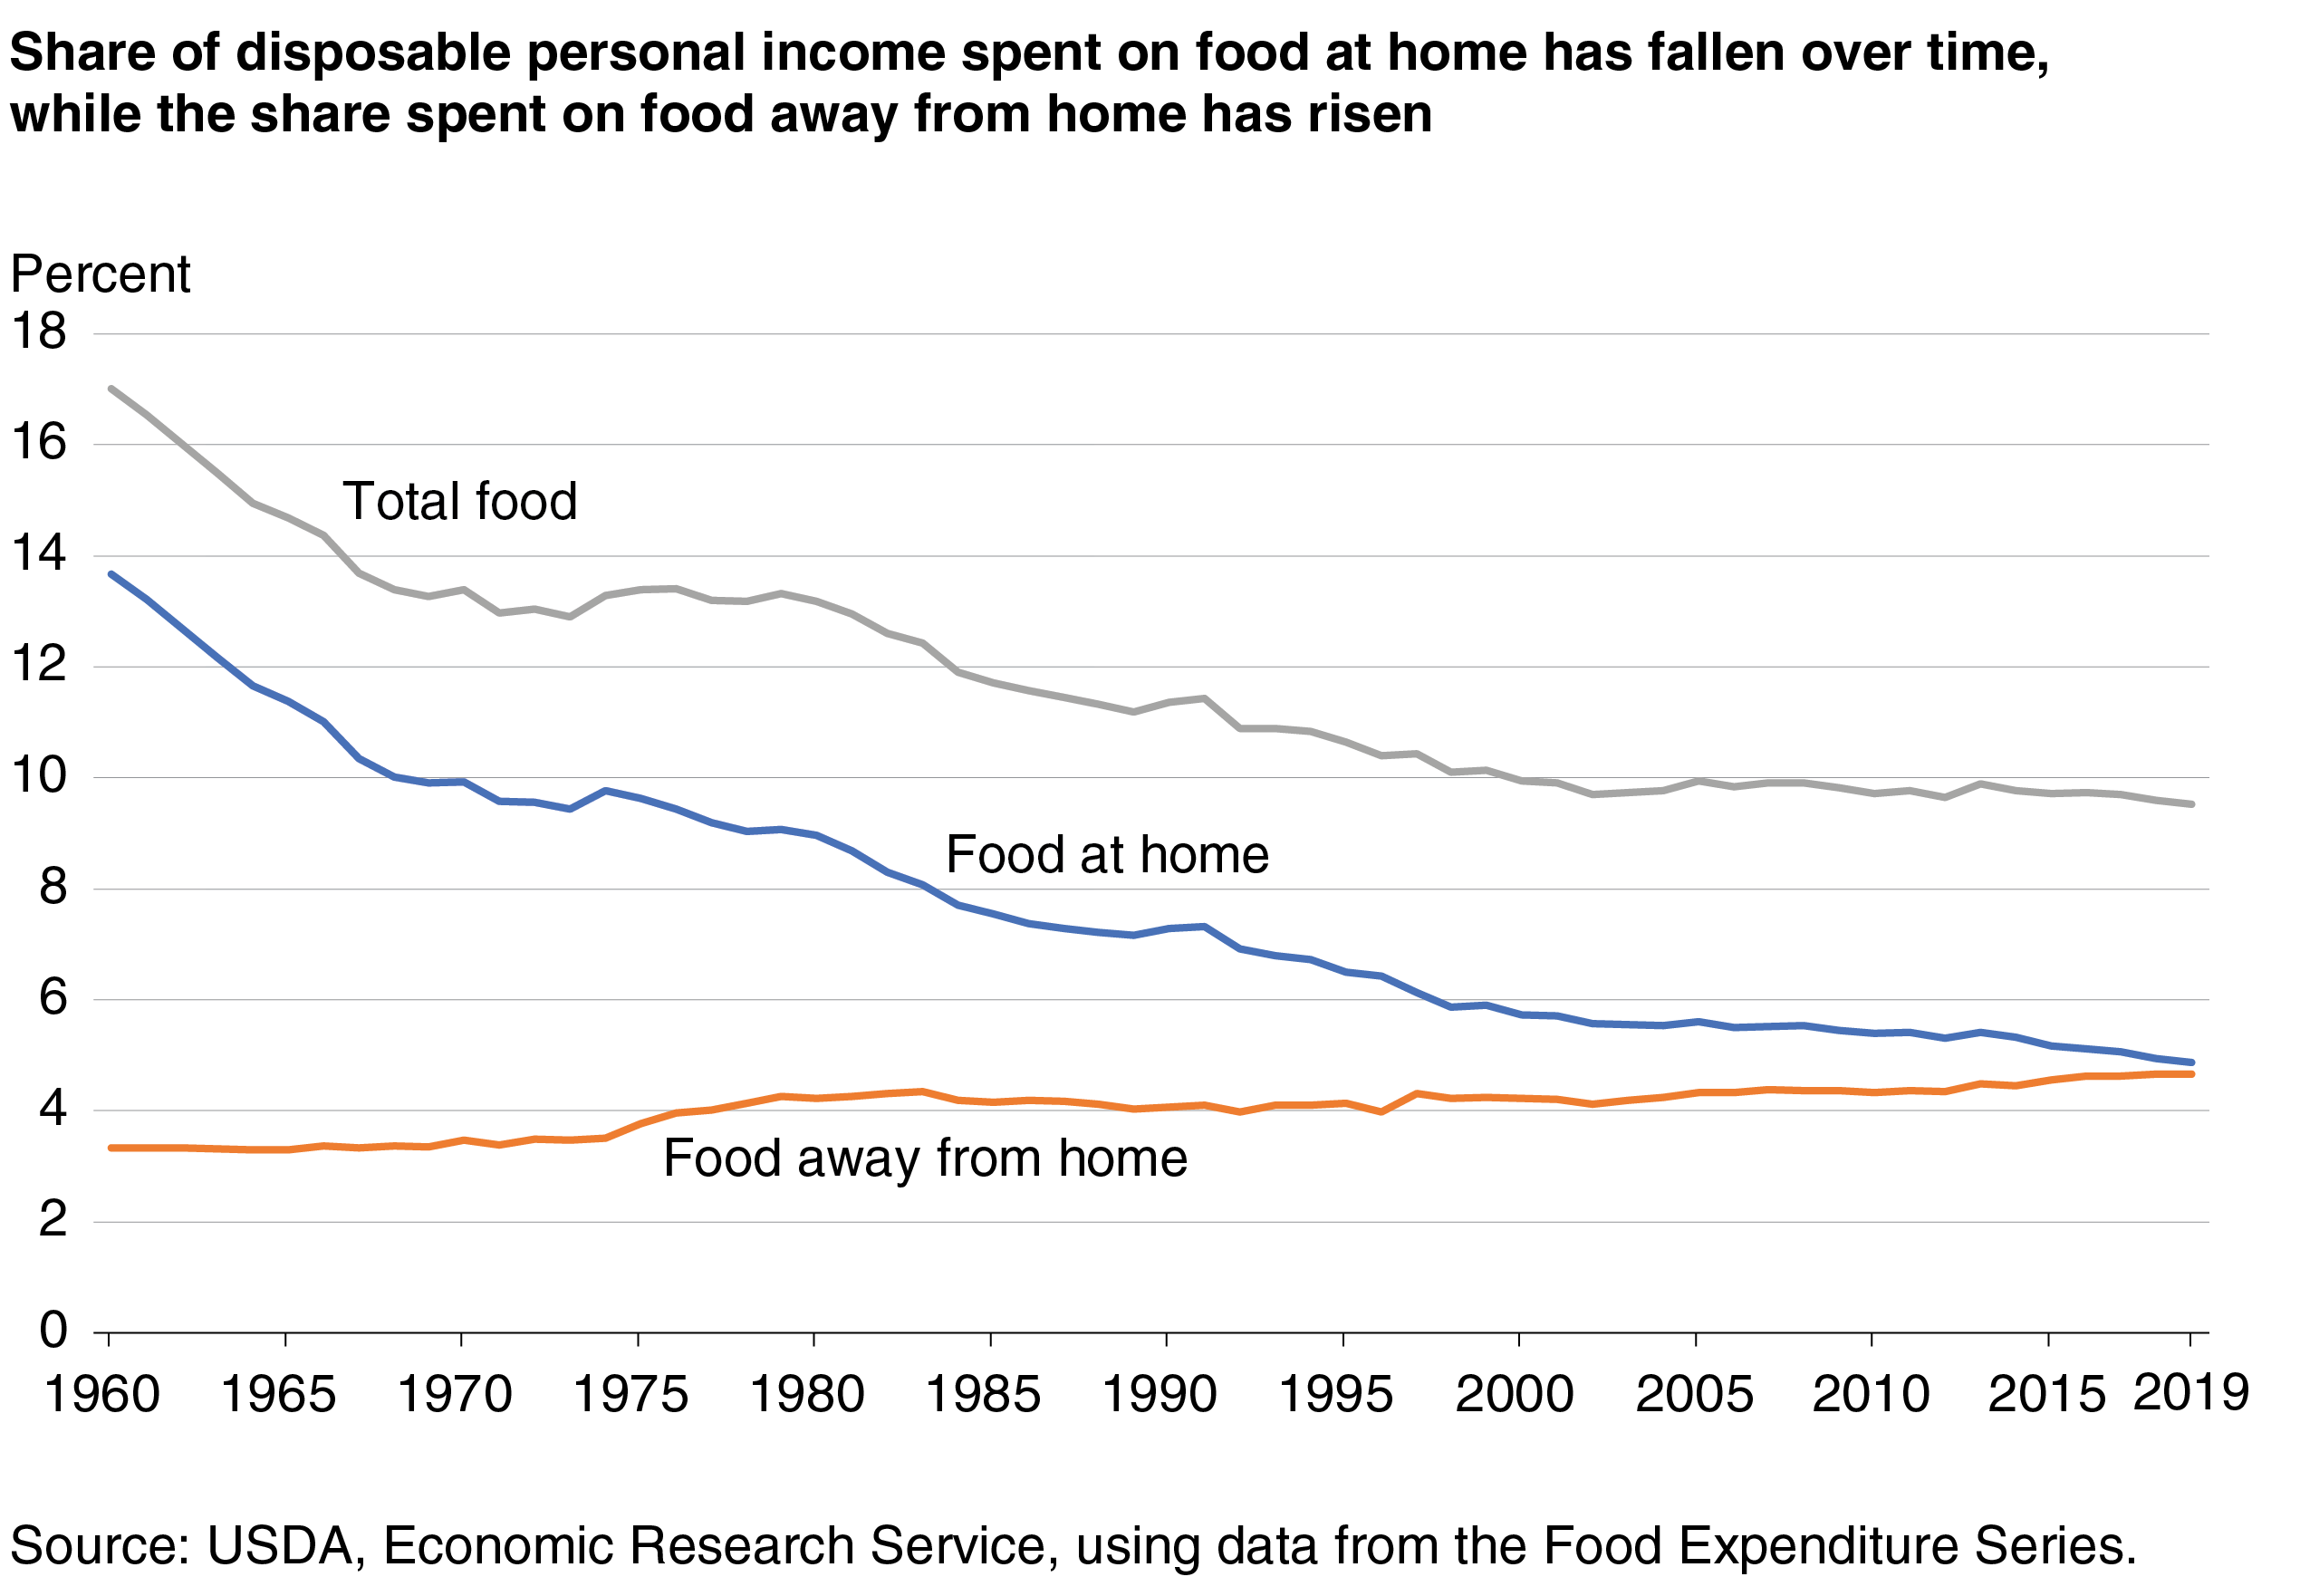
A line graph showing the percent of disposable personal income spent on total food, food at home, and food away from home for 1960-2019