

SNAP participation and spending respond to economic conditions
- by Laura Tiehen
- 10/7/2020
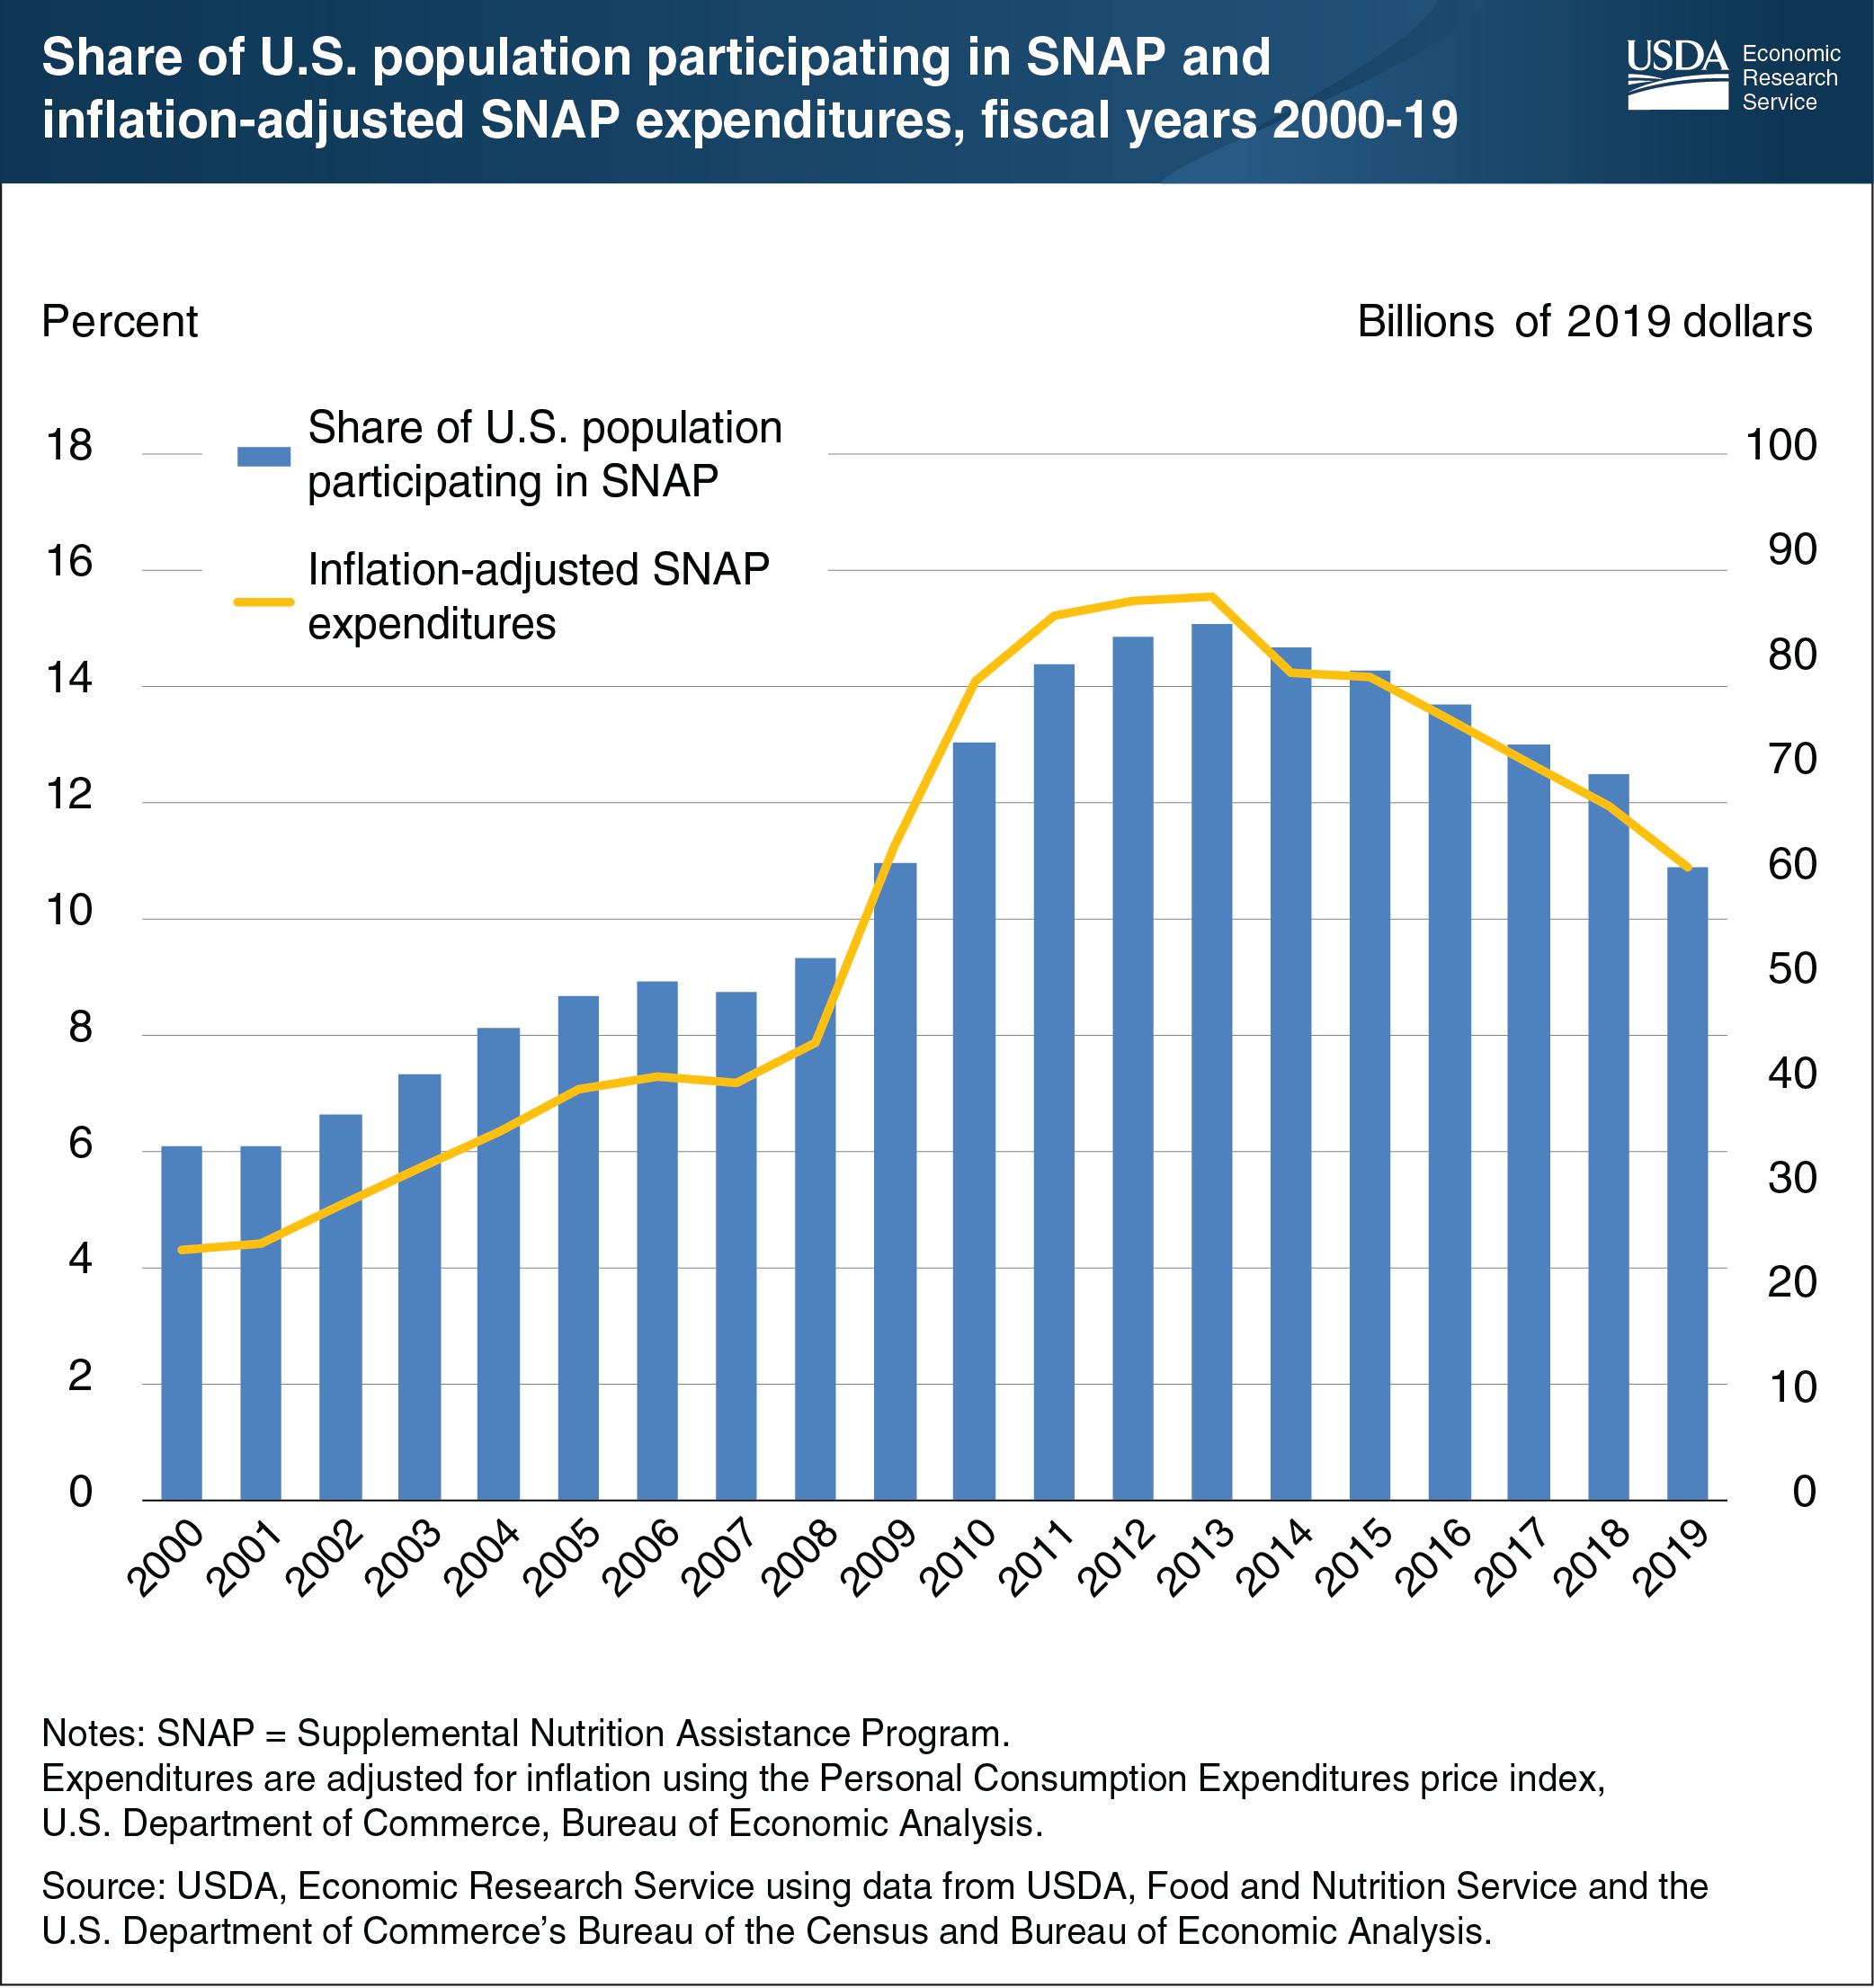
The Supplemental Nutrition Assistance Program (SNAP) accounted for 65 percent of the $92.4 billion USDA spent on food and nutrition assistance in fiscal year (FY) 2019. From FYs 2000 to 2007, between 6 and 9 percent of Americans participated in SNAP in a typical month. As economic conditions during the 2007-09 recession increased the need for food assistance, the share of Americans participating in SNAP rose, eventually peaking in FY 2013 when 15 percent of the U.S. population participated in the program each month. Between FYs 2013 and 2019, the share of the population receiving SNAP benefits steadily fell each year as economic conditions improved. In FY 2019, 10.9 percent of the population participated in the program. Accompanying the decrease in participation, SNAP expenditures in FY 2019 were 30 percent less than the inflation-adjusted historical high of $86.3 billion (or $79.9 billion in 2013 dollars) set in FY 2013. Job losses that accompanied the COVID-19 related shutdown of schools, businesses, and many other activities in spring 2020 increased the need for food assistance. Preliminary USDA data show the number of Americans receiving SNAP benefits was 14.9 percent higher in April 2020 than in April 2019. The data for this chart are from the Economic Research Service report, The Food Assistance Landscape: Fiscal Year 2019 Annual Report, July 2020.