

Conservation spending remained roughly level in recent years, a trend projected to continue through 2023
- by Steven Wallander
- 10/5/2020
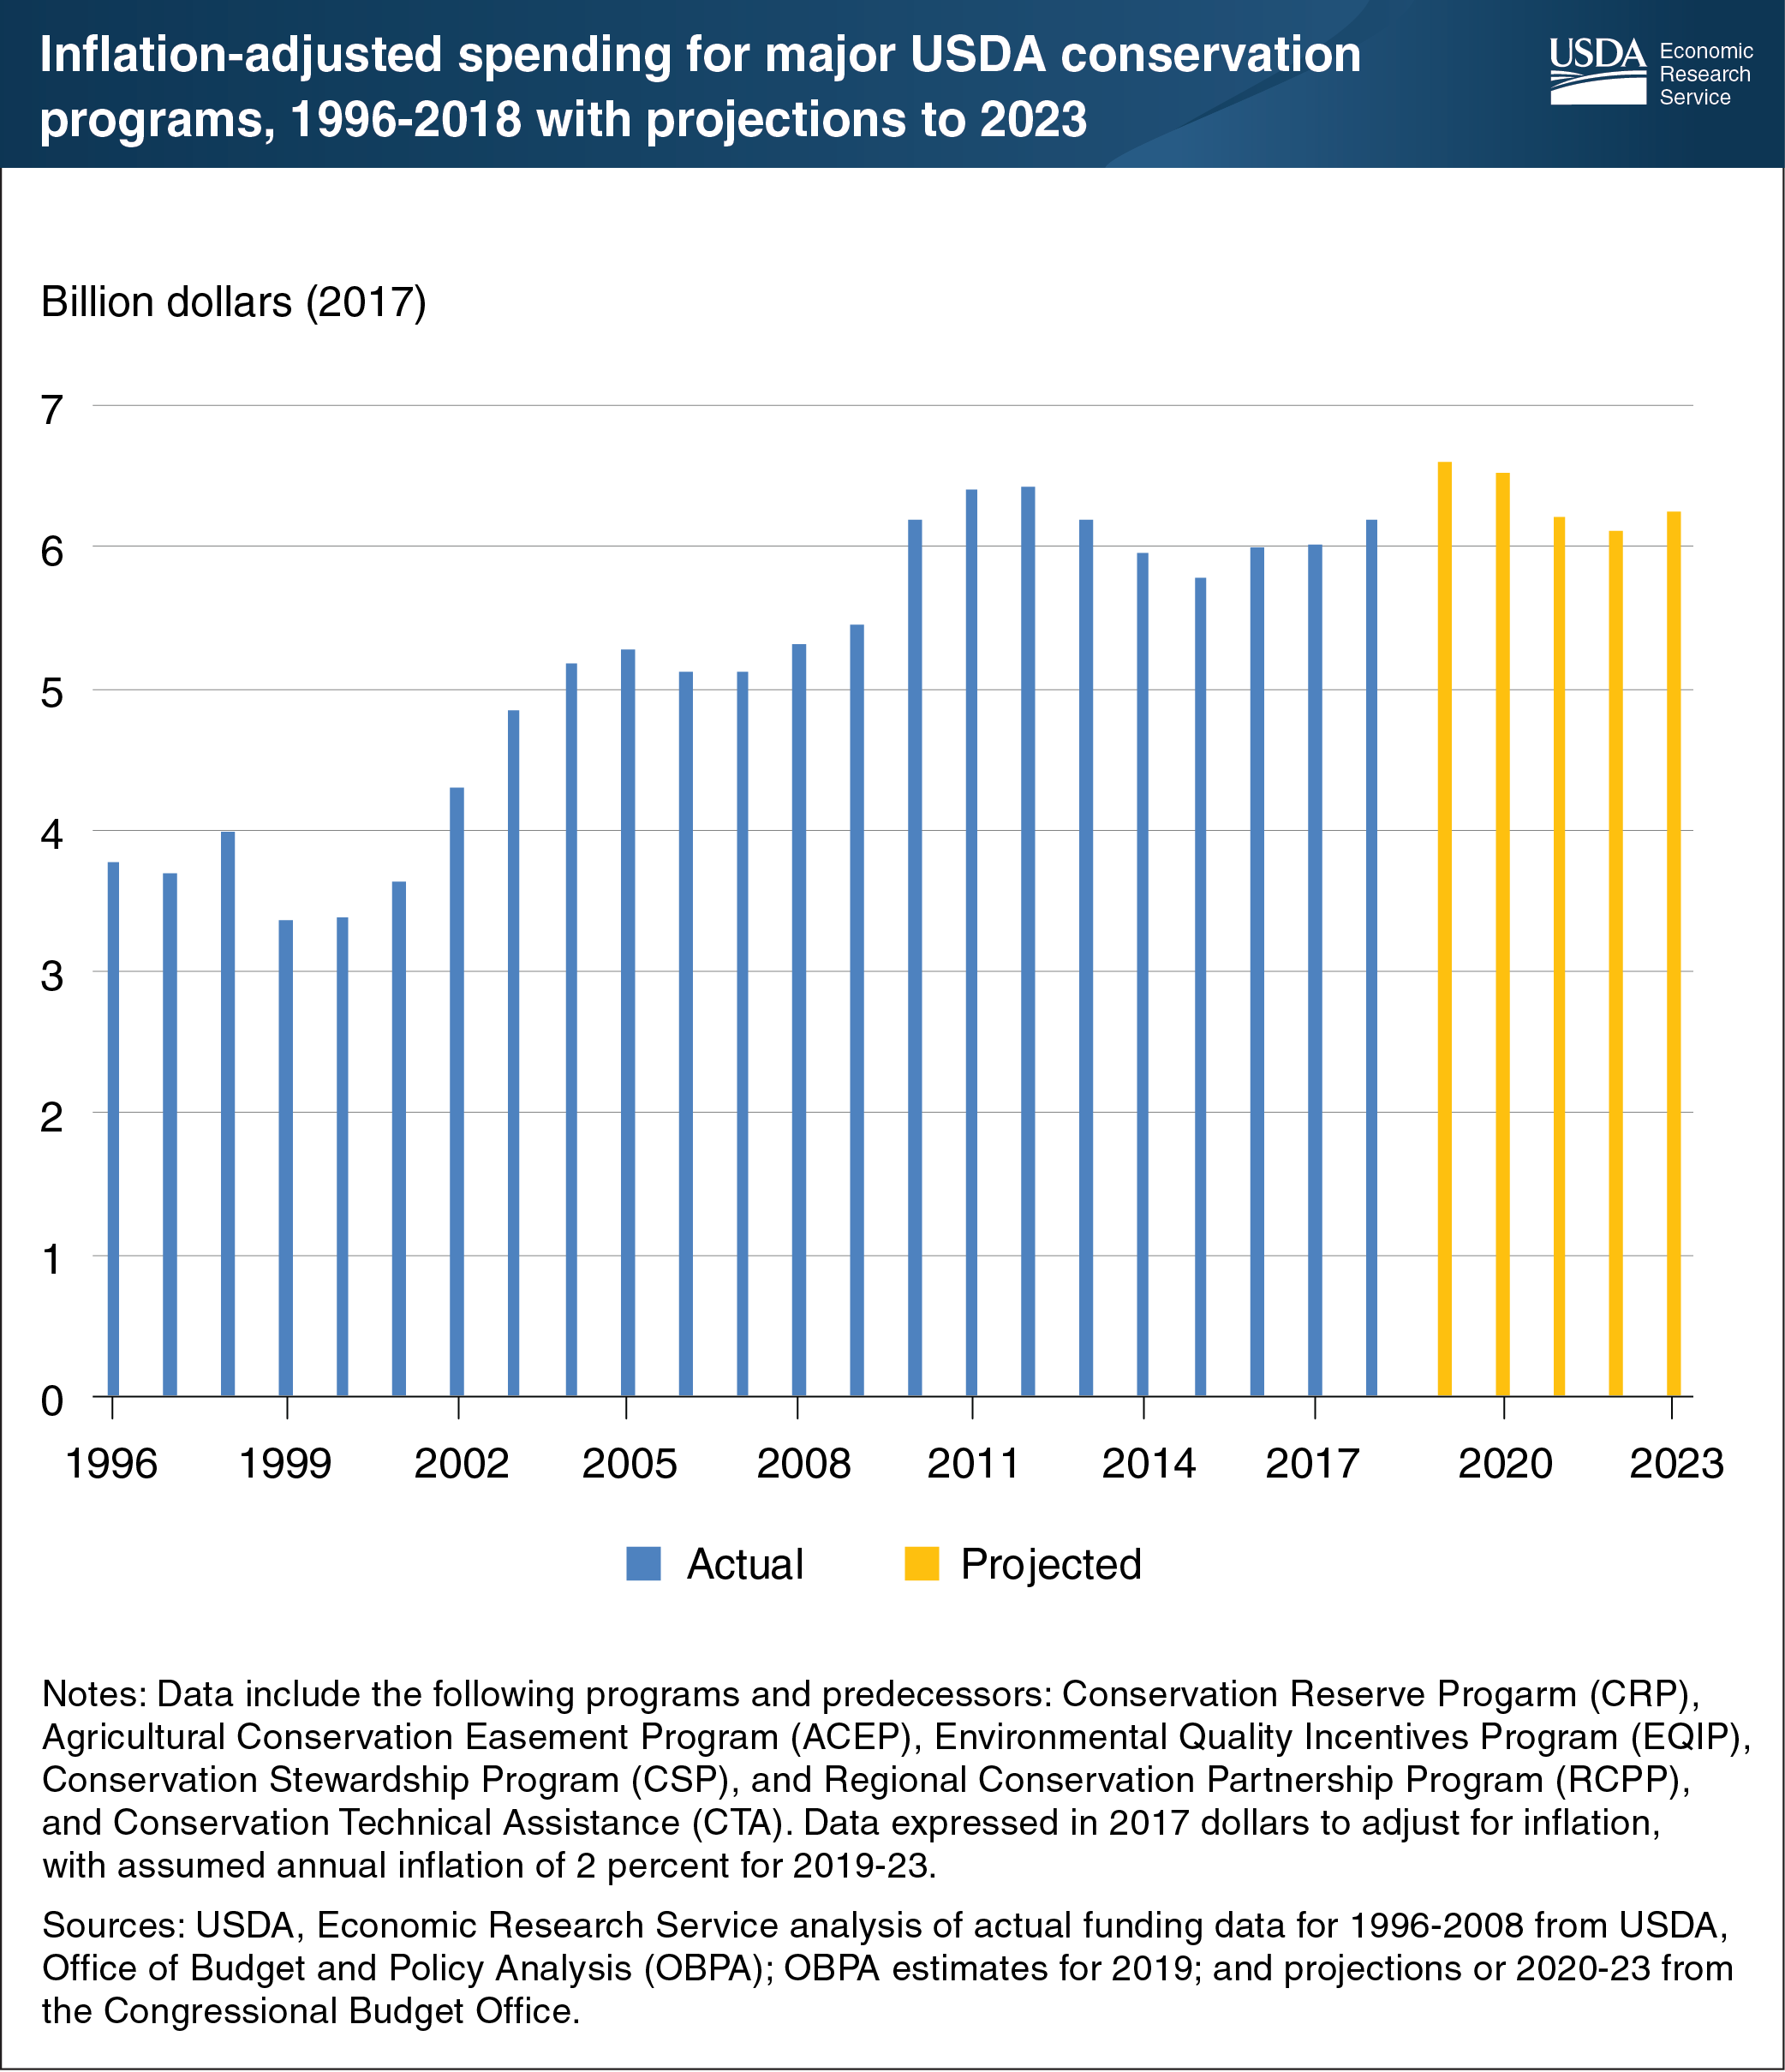
USDA’s voluntary conservation programs form the backbone of U.S. agricultural conservation policy. These programs include the Conservation Reserve Program, Agricultural Conservation Easement Program, Environmental Quality Incentives Program, Conservation Stewardship Program, Regional Conservation Partnership Program, and Conservation Technical Assistance. The programs help agricultural producers improve their environmental performance related to soil health, water quality, air quality, wildlife habitat, and greenhouse gas emissions. Between 1996 and 2011, real (inflation-adjusted) conservation spending grew by roughly 50 percent, largely due to expansion of the major working lands programs. Since 2011, annual spending has remained between $6.0 and $6.5 billion (except in 2015) and is projected to remain within that range between 2019 and 2023. Under the Agriculture Improvement Act of 2018 (also known as the 2018 Farm Act), the Congressional Budget Office (CBO) estimates mandatory conservation spending of $29.5 billion over 5 years. This is about $560 million more than CBO’s projection of 2019-23 spending with the extension of the programs and provisions of the 2014 Farm Act. Although most conservation programs receive “mandatory” funding, the funding levels are not guaranteed and could be revised in future years. This chart appears in the ERS topic page for Conservation Programs, updated September 2019.