

Americans obtained just over one-third of their vegetables in away-from-home eating places in 2007-08
- by Biing-Hwan Lin
- 6/17/2020
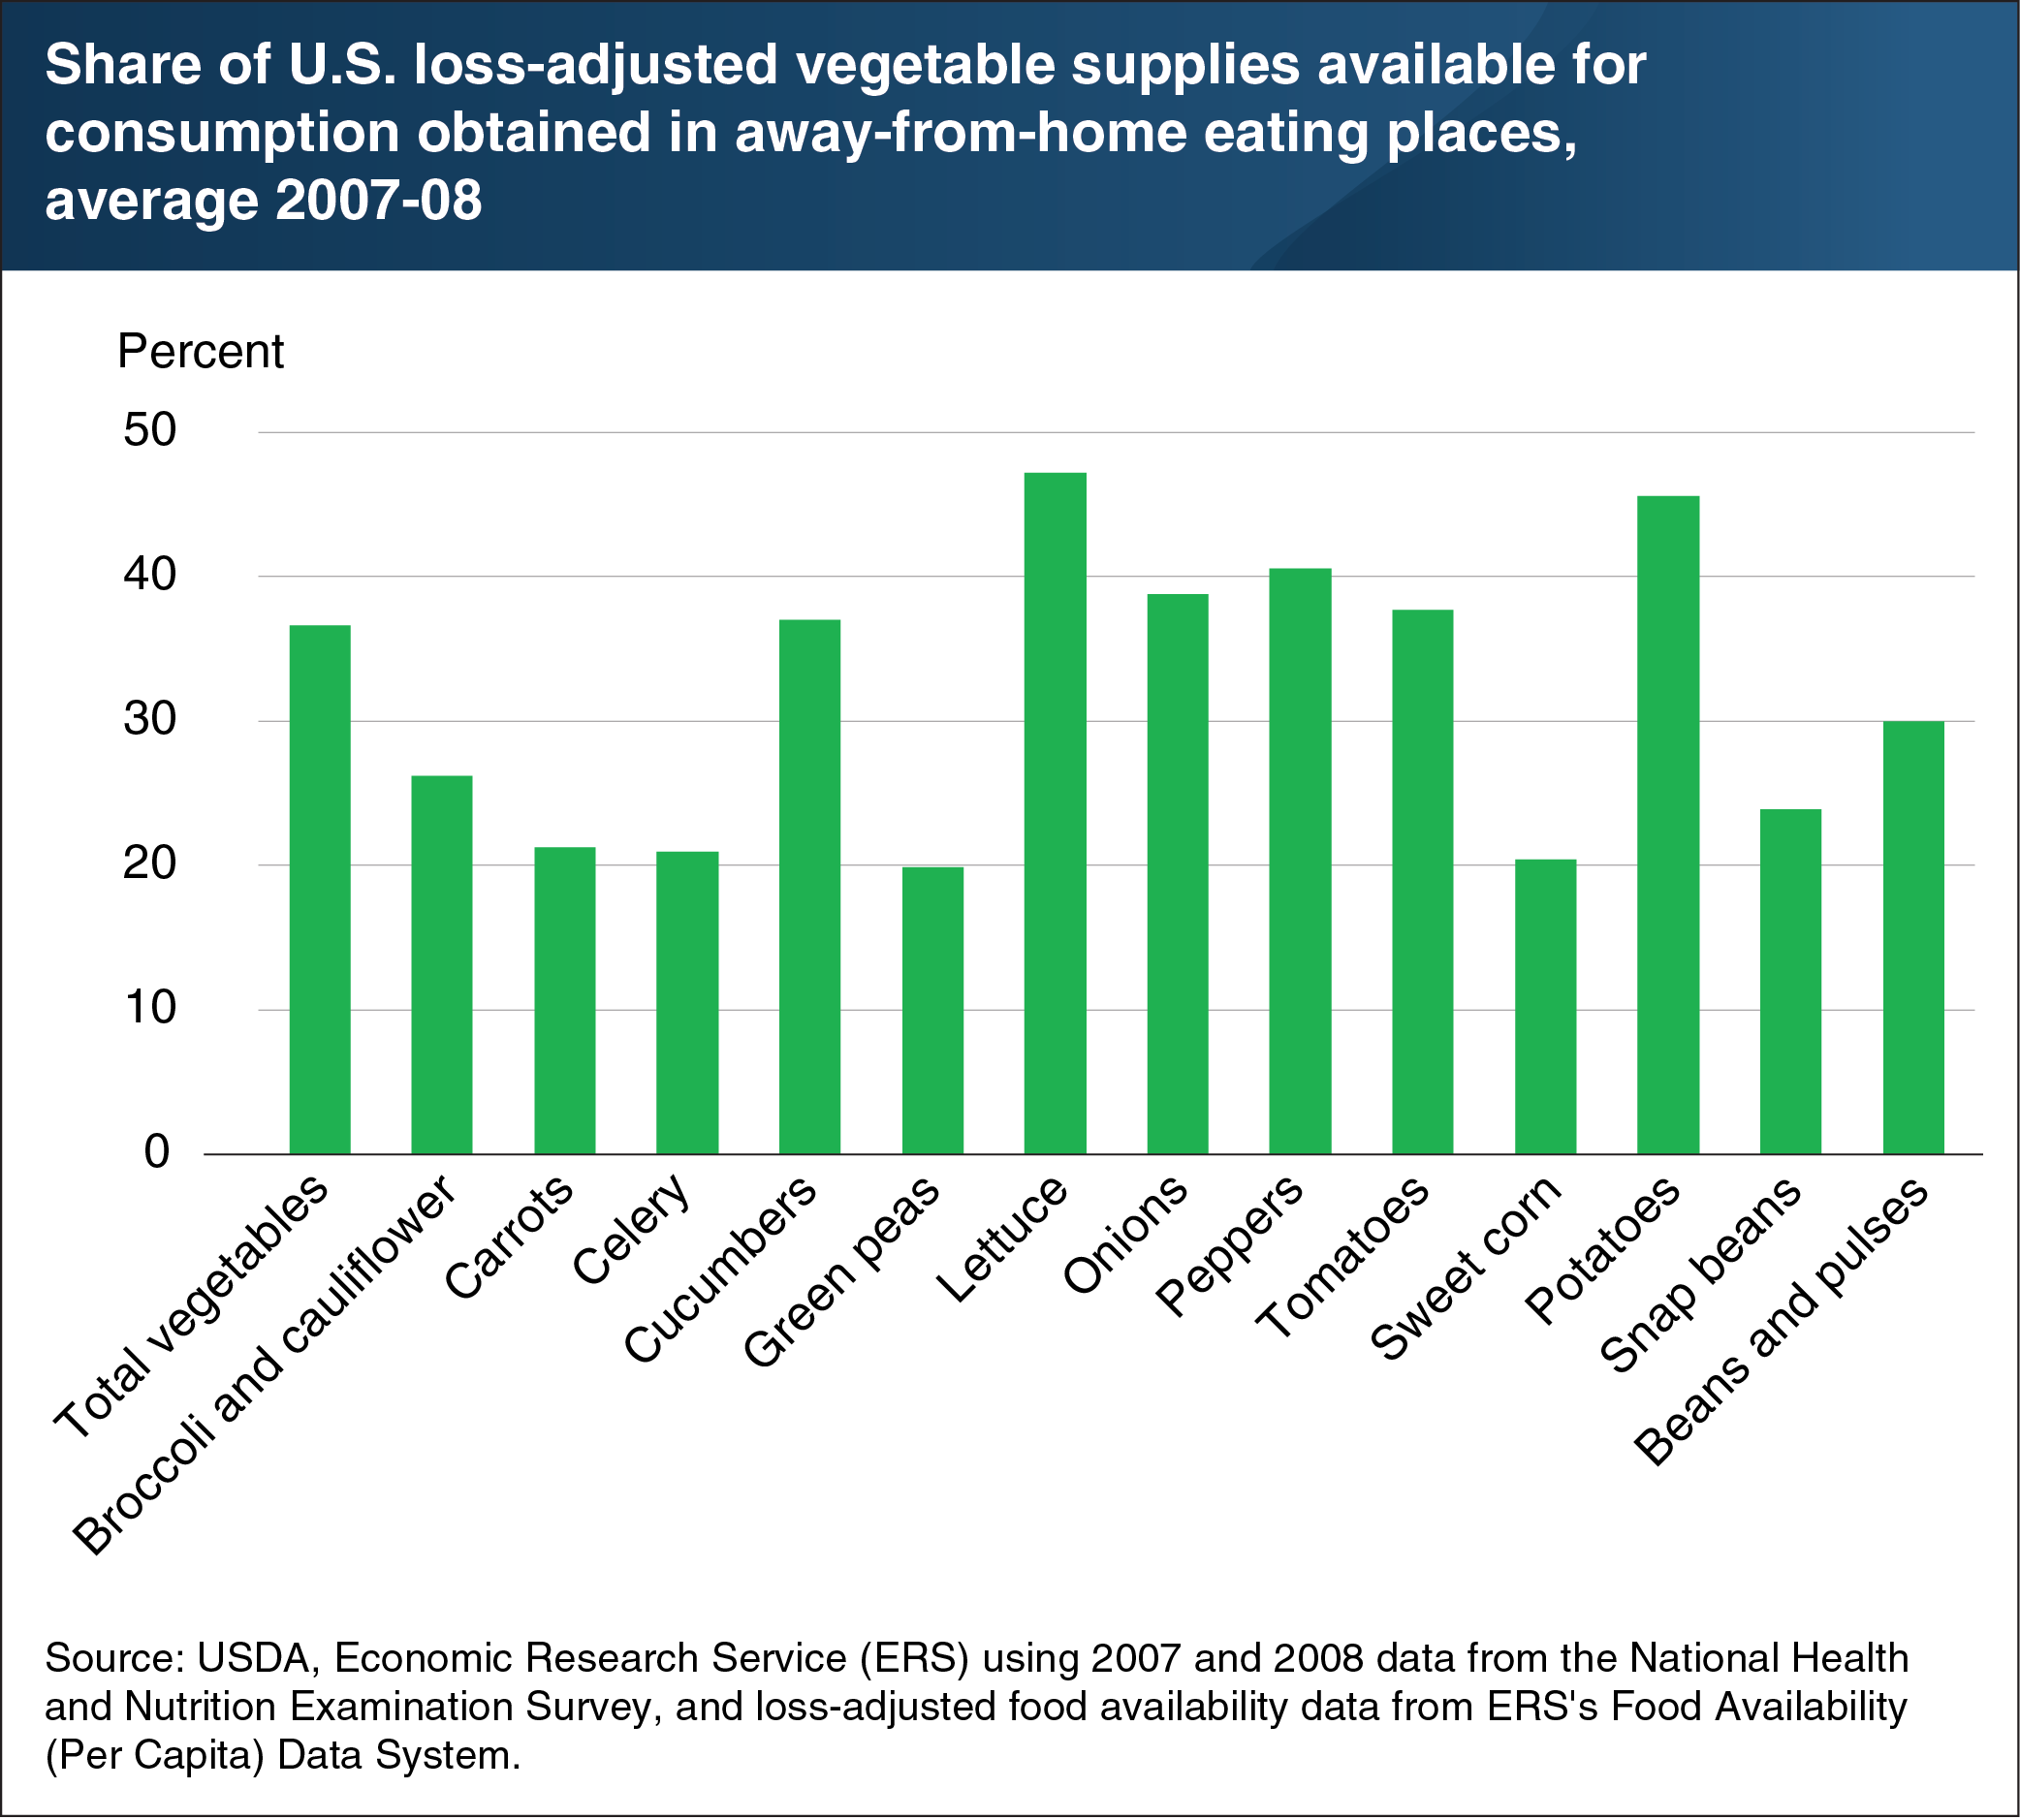
COVID-19-related stay-at-home orders have shifted the places where consumers obtain a large share of their meals and snacks. Foods bought in grocery stores have replaced meals and snacks previously eaten in restaurants, college dining halls, school cafeterias, sports venues, and other eating-out places. Results from a 2016 Economic Research Service (ERS) study indicate this shift in where Americans obtain their foods is likely to affect the marketing and consumption of specific vegetables differently, depending on what share of a vegetable’s total consumption is obtained in away-from-home eating places and whether that share has changed over the last decade. In 2007-08 (the latest food-intake survey used in the 2016 study), Americans obtained 36.6 percent of their vegetables away from home. Lettuce and potatoes had the highest away-from-home shares at 47.2 and 45.6 percent, respectively. Green peas and sweet corn had the lowest away-from-home shares of the vegetables examined—just 20 percent of these vegetables were obtained at away-from-home eating places in 2007-08. ERS researchers used national survey data on foods eaten and where they were acquired to disaggregate 63 commodities in ERS’s Loss-Adjusted Food Availability data system into two broad categories: food at home (foods obtained at grocery stores, supercenters, and other retailers) and food away from home (foods obtained at away-from-home eating places). ERS’s loss-adjusted food availability data take per capita supplies of food commodities in all forms—fresh, canned, frozen, and dried—available for human consumption. The data adjust for some of the spoilage, plate waste, and other losses in grocery stores, restaurants, and homes. The data in this chart appear in the 2016 ERS report, U.S. Food Commodity Availability by Food Source, 1994-2008.