
Labor costs on specialty crop farms accounted for 3 times as much of their total cash expenses as the average for all U.S. farms
- by Dipak Subedi
- 6/9/2020
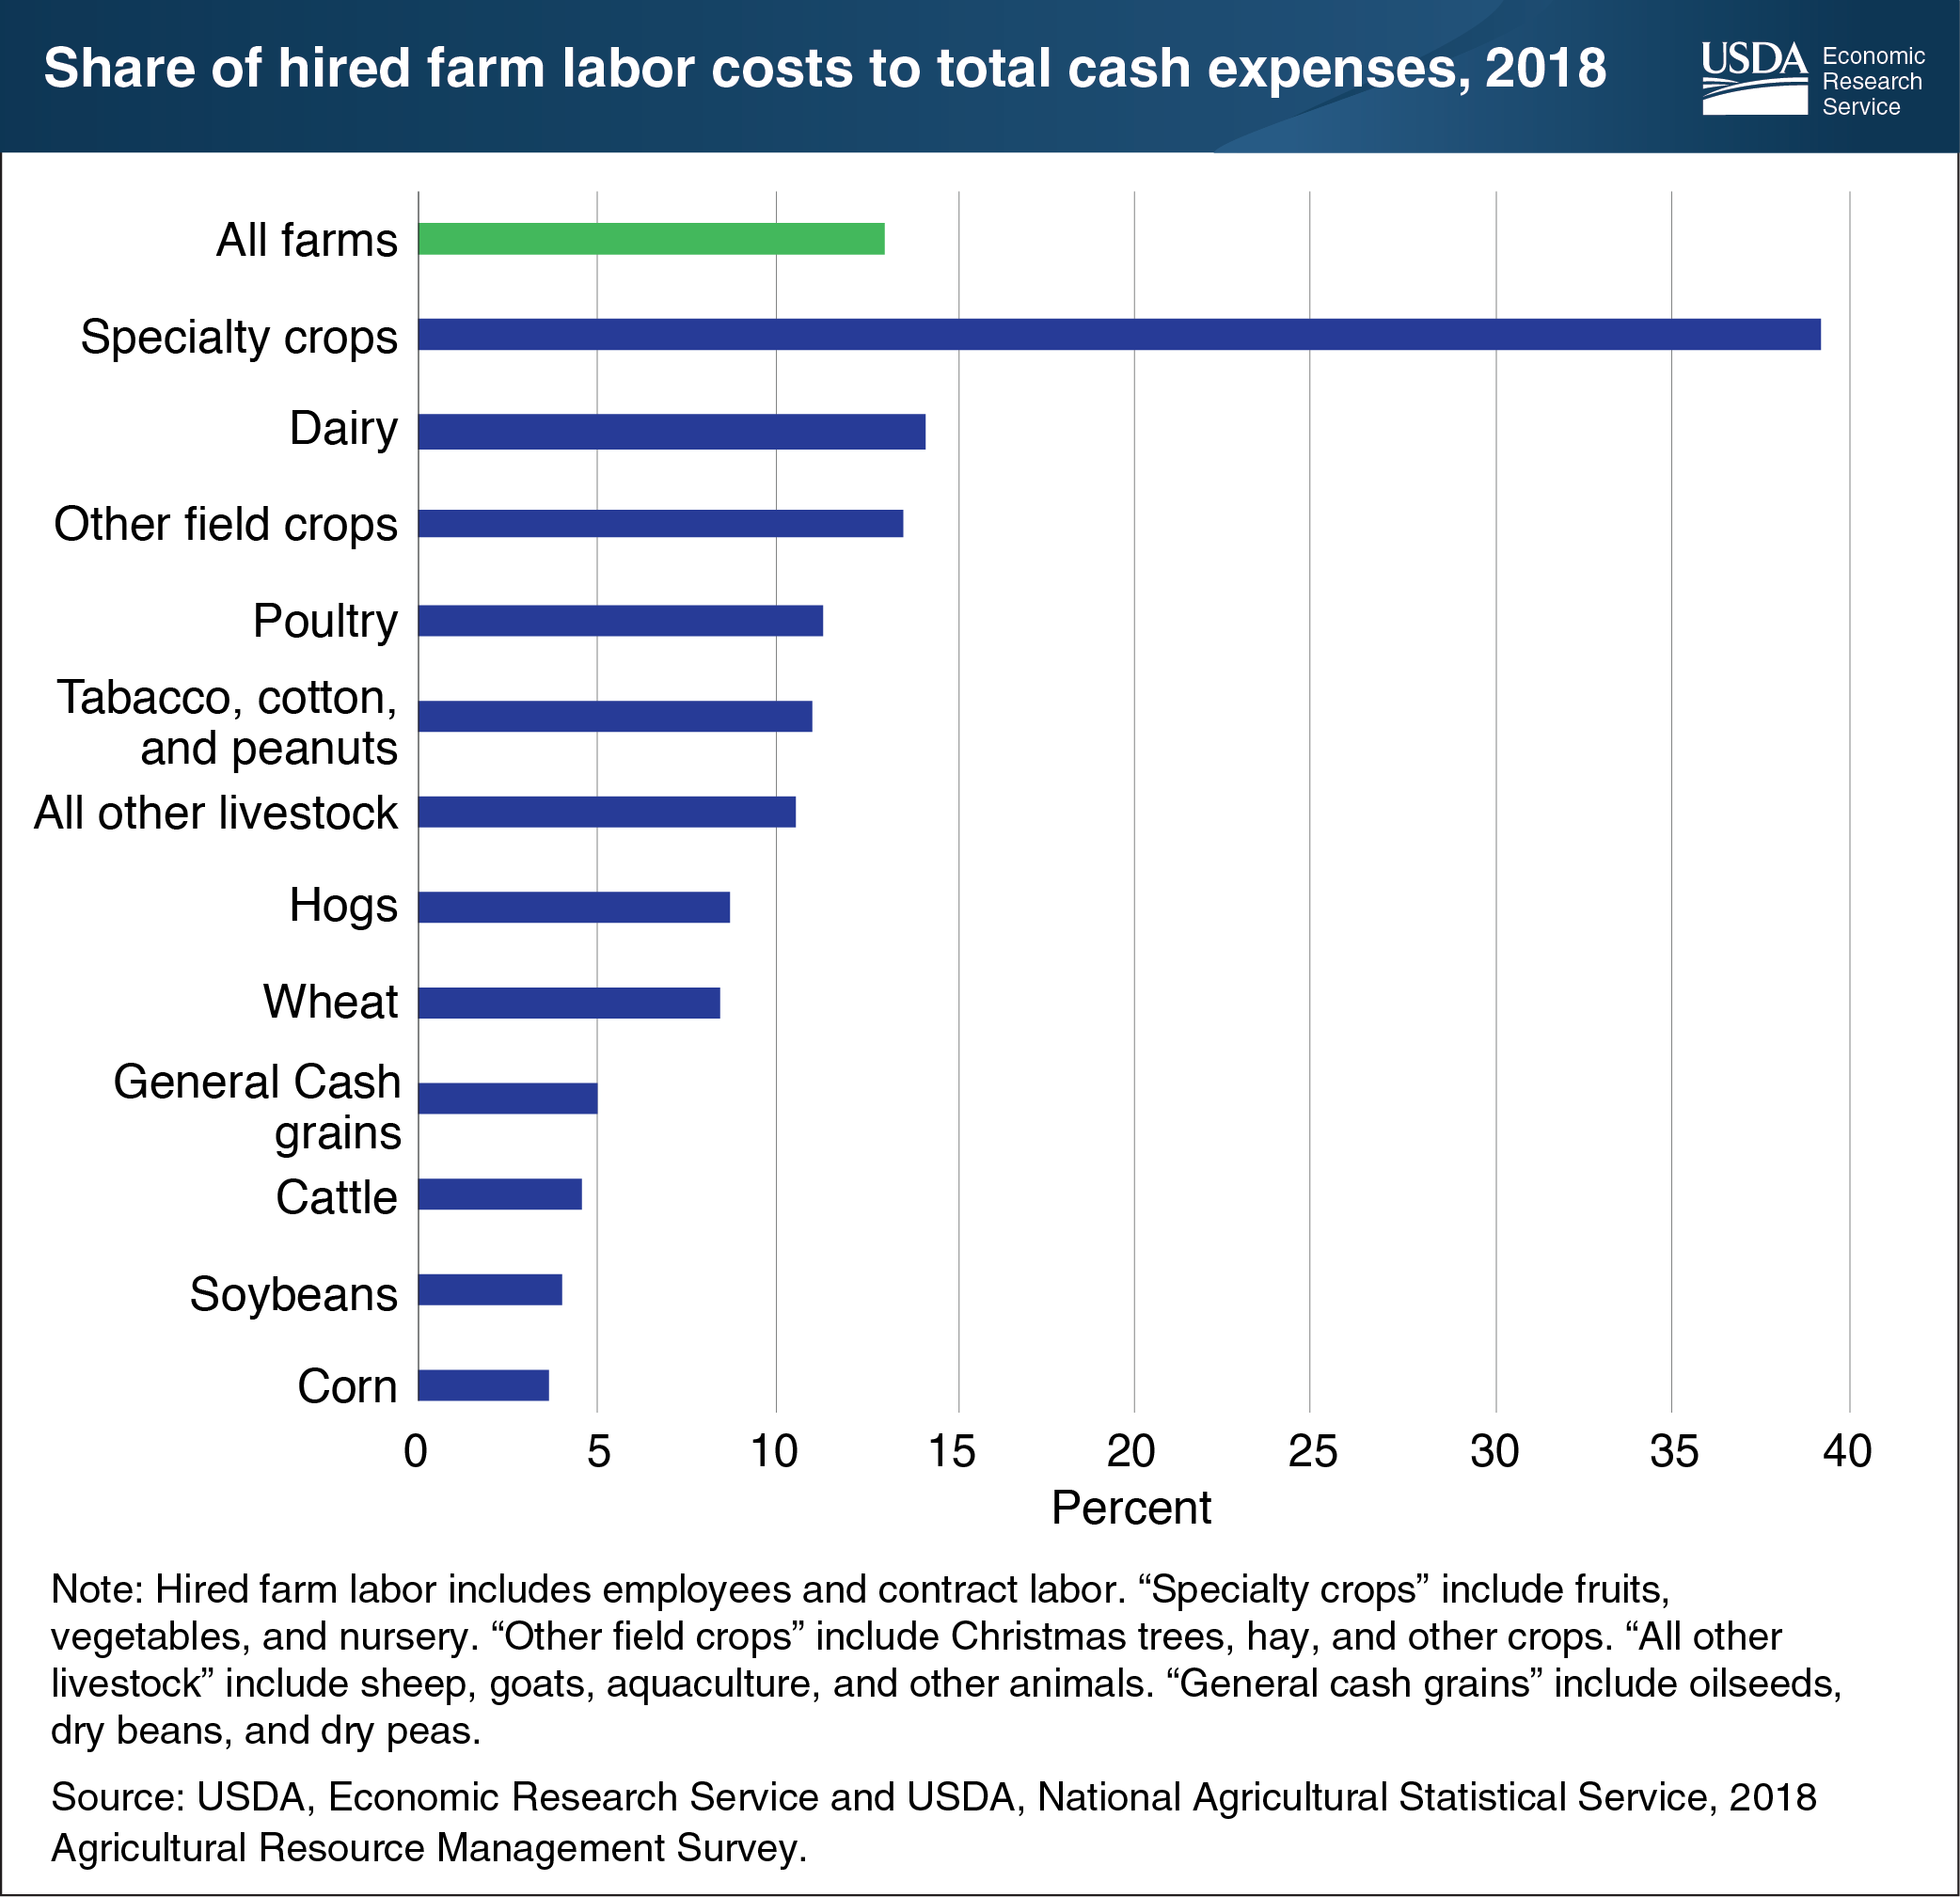
Some types of farms rely more on farm labor than others. According to data from USDA’s Agricultural Resources Management Survey, hired farm labor (including employees and contract labor) accounted for 13 percent, on average, of the total input costs used in agricultural production in 2018 (trailing only expenditures on fertilizer and chemicals). Specialty crop farms—which produce fruits, vegetables, and nursery crops—had the highest share of labor costs to total cash expenses at 39 percent. This made them the most vulnerable to labor shortages or wage shocks. The share of labor costs to total cash expenses for specialty crop farms was more than 3 times higher than the average for all farms. Dairy farms had the second highest share of labor costs at 14 percent, with large dairy farms mainly relying on hired labor. In contrast, corn and soybean farms rely mostly on unpaid operator and family labor, so paid labor accounted for less than 4 percent of total cash expenses in 2018. This chart updates data found in the Economic Research Service report, Farm Size and the Organization of U.S. Crop Farming, published in August 2013.