
Except for forest products, natural resource use by the U.S. food system is higher than its share of U.S. GDP
- by Patrick Canning
- 5/6/2020
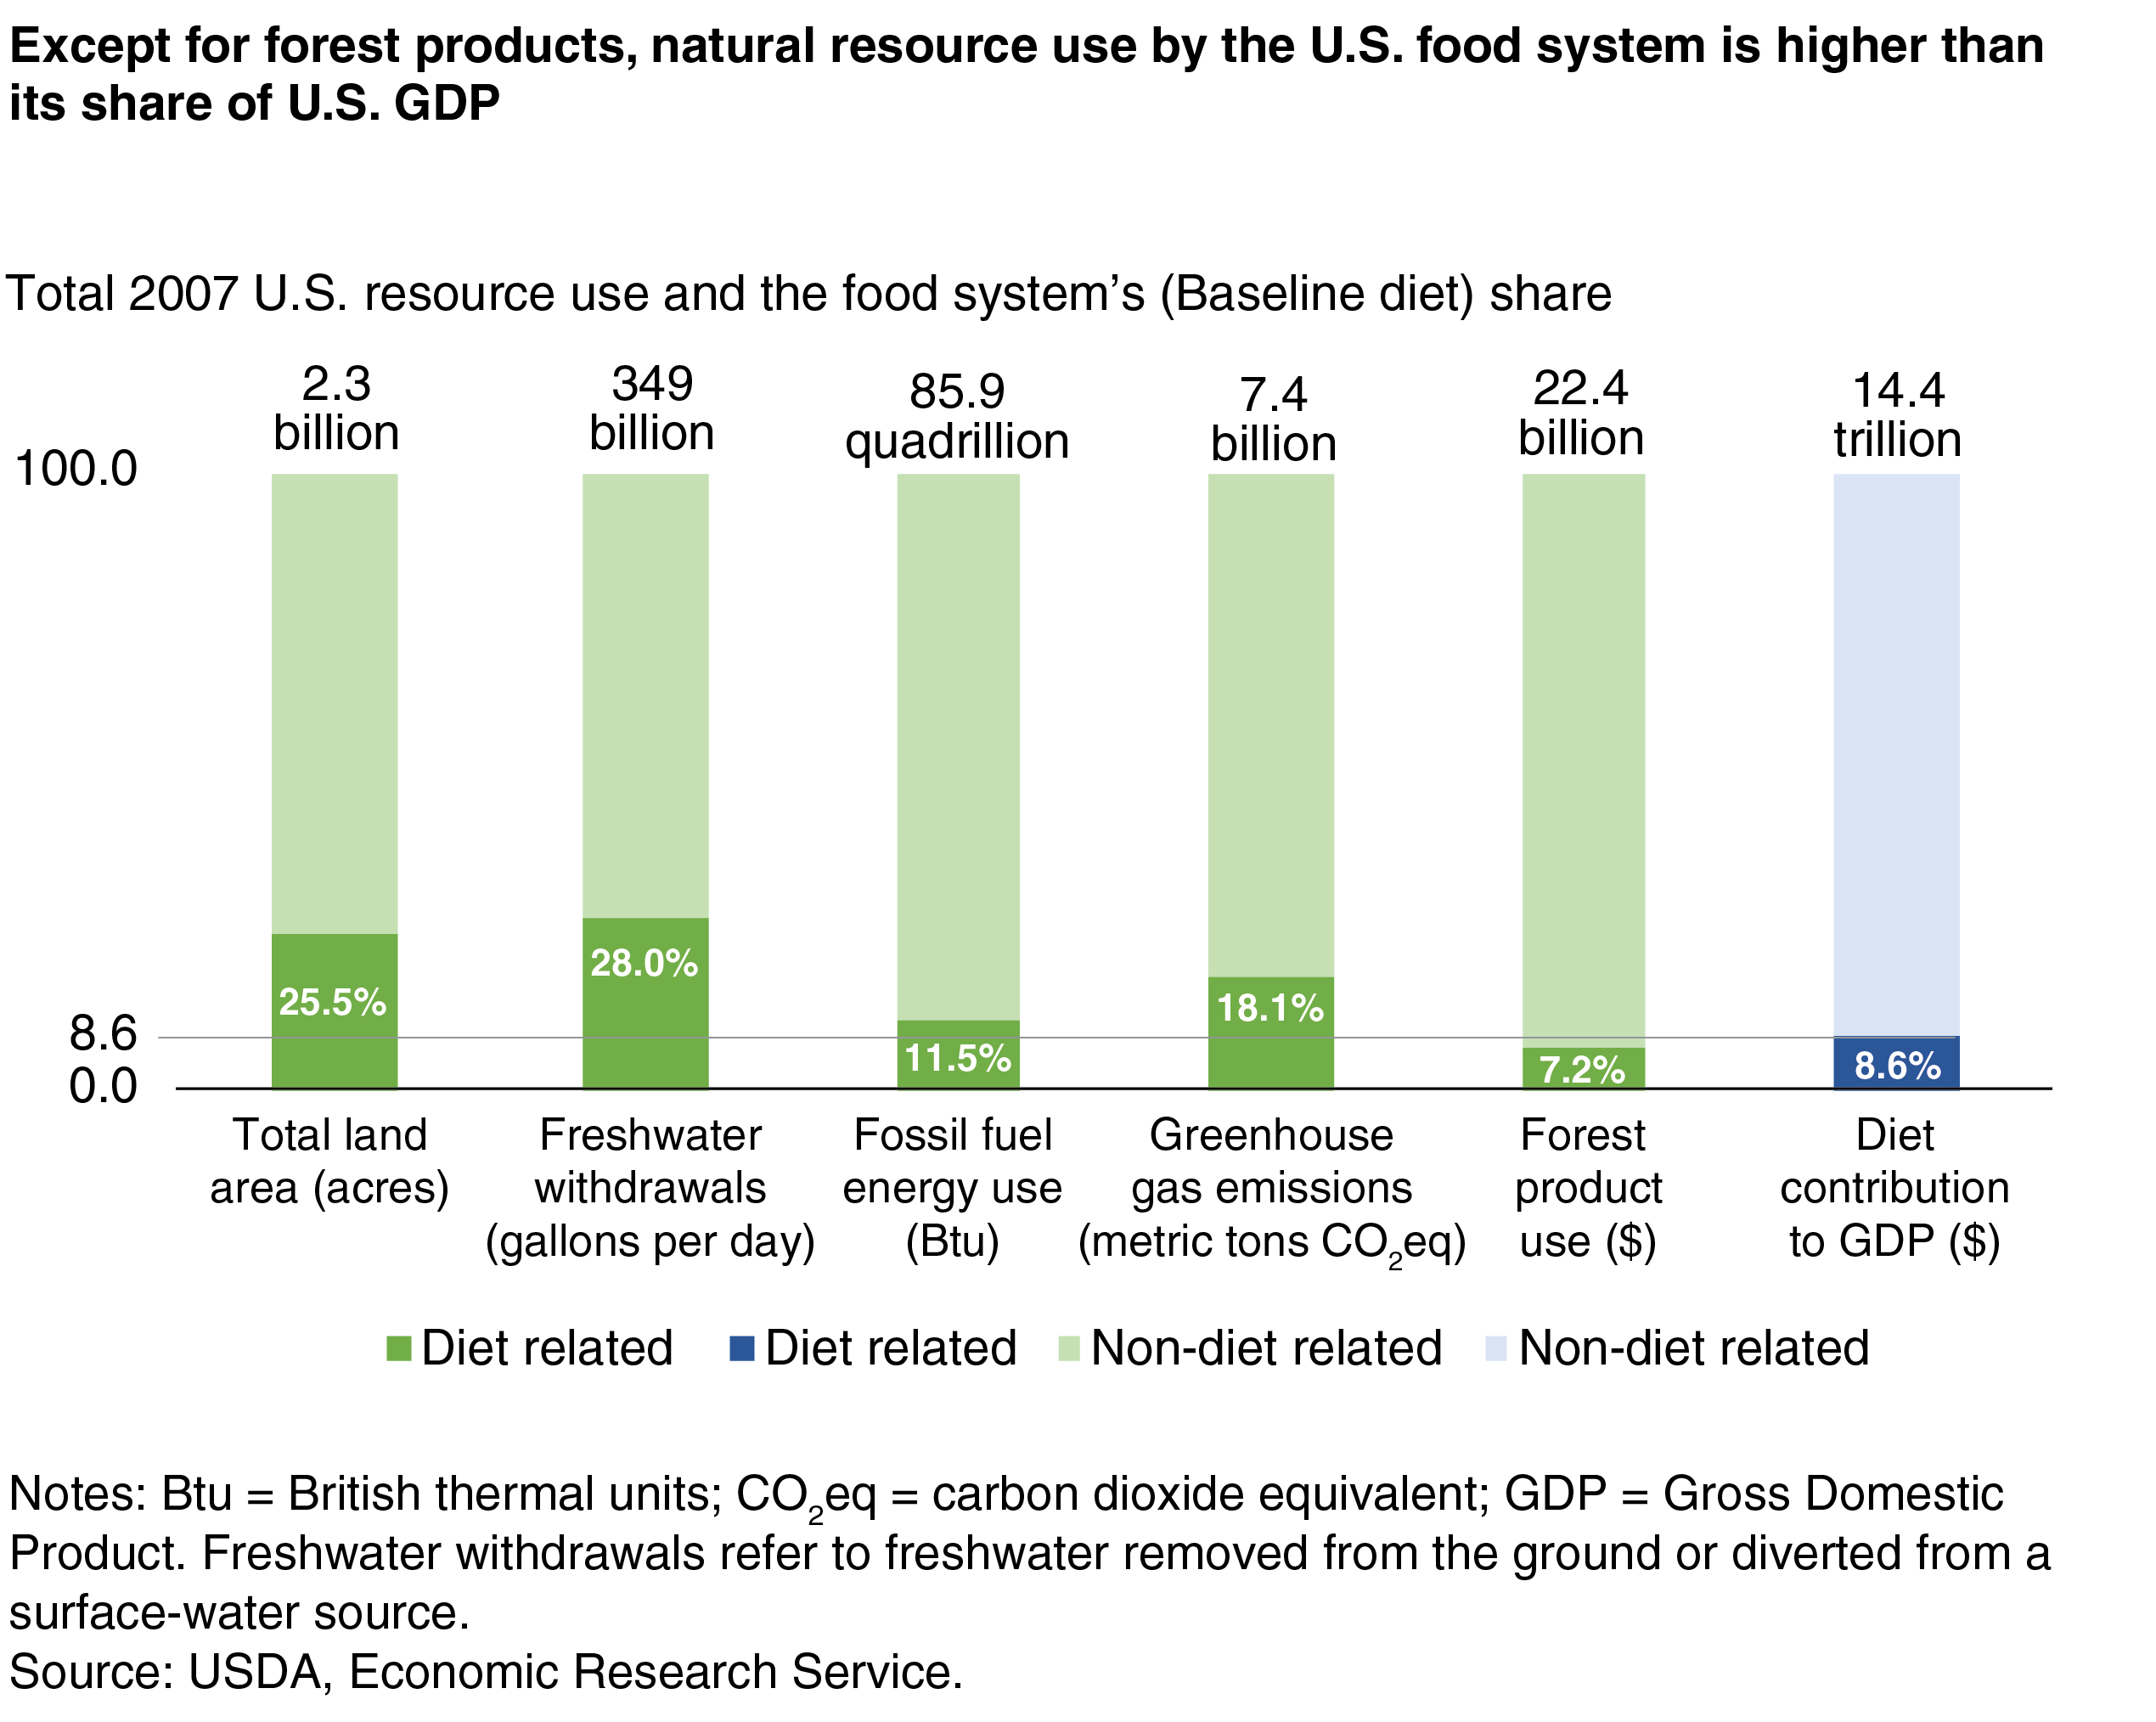
A bar chart showing the food system’s share of total U.S. natural resource use in 2007 for land, freshwater, fossil fuels, forest products, and greenhouse gas emissions compared to the U.S. diet’s contribution to GDP
Errata: On September 15, 2020, this chart was revised to correctly identify the units for greenhouse gasses as metric tons.