

Public agricultural research expenditures as a percentage of agricultural GDP has fallen in high-income countries since 2009
- by Paul Heisey, Keith Fuglie and Dennis Vilorio
- 12/4/2019
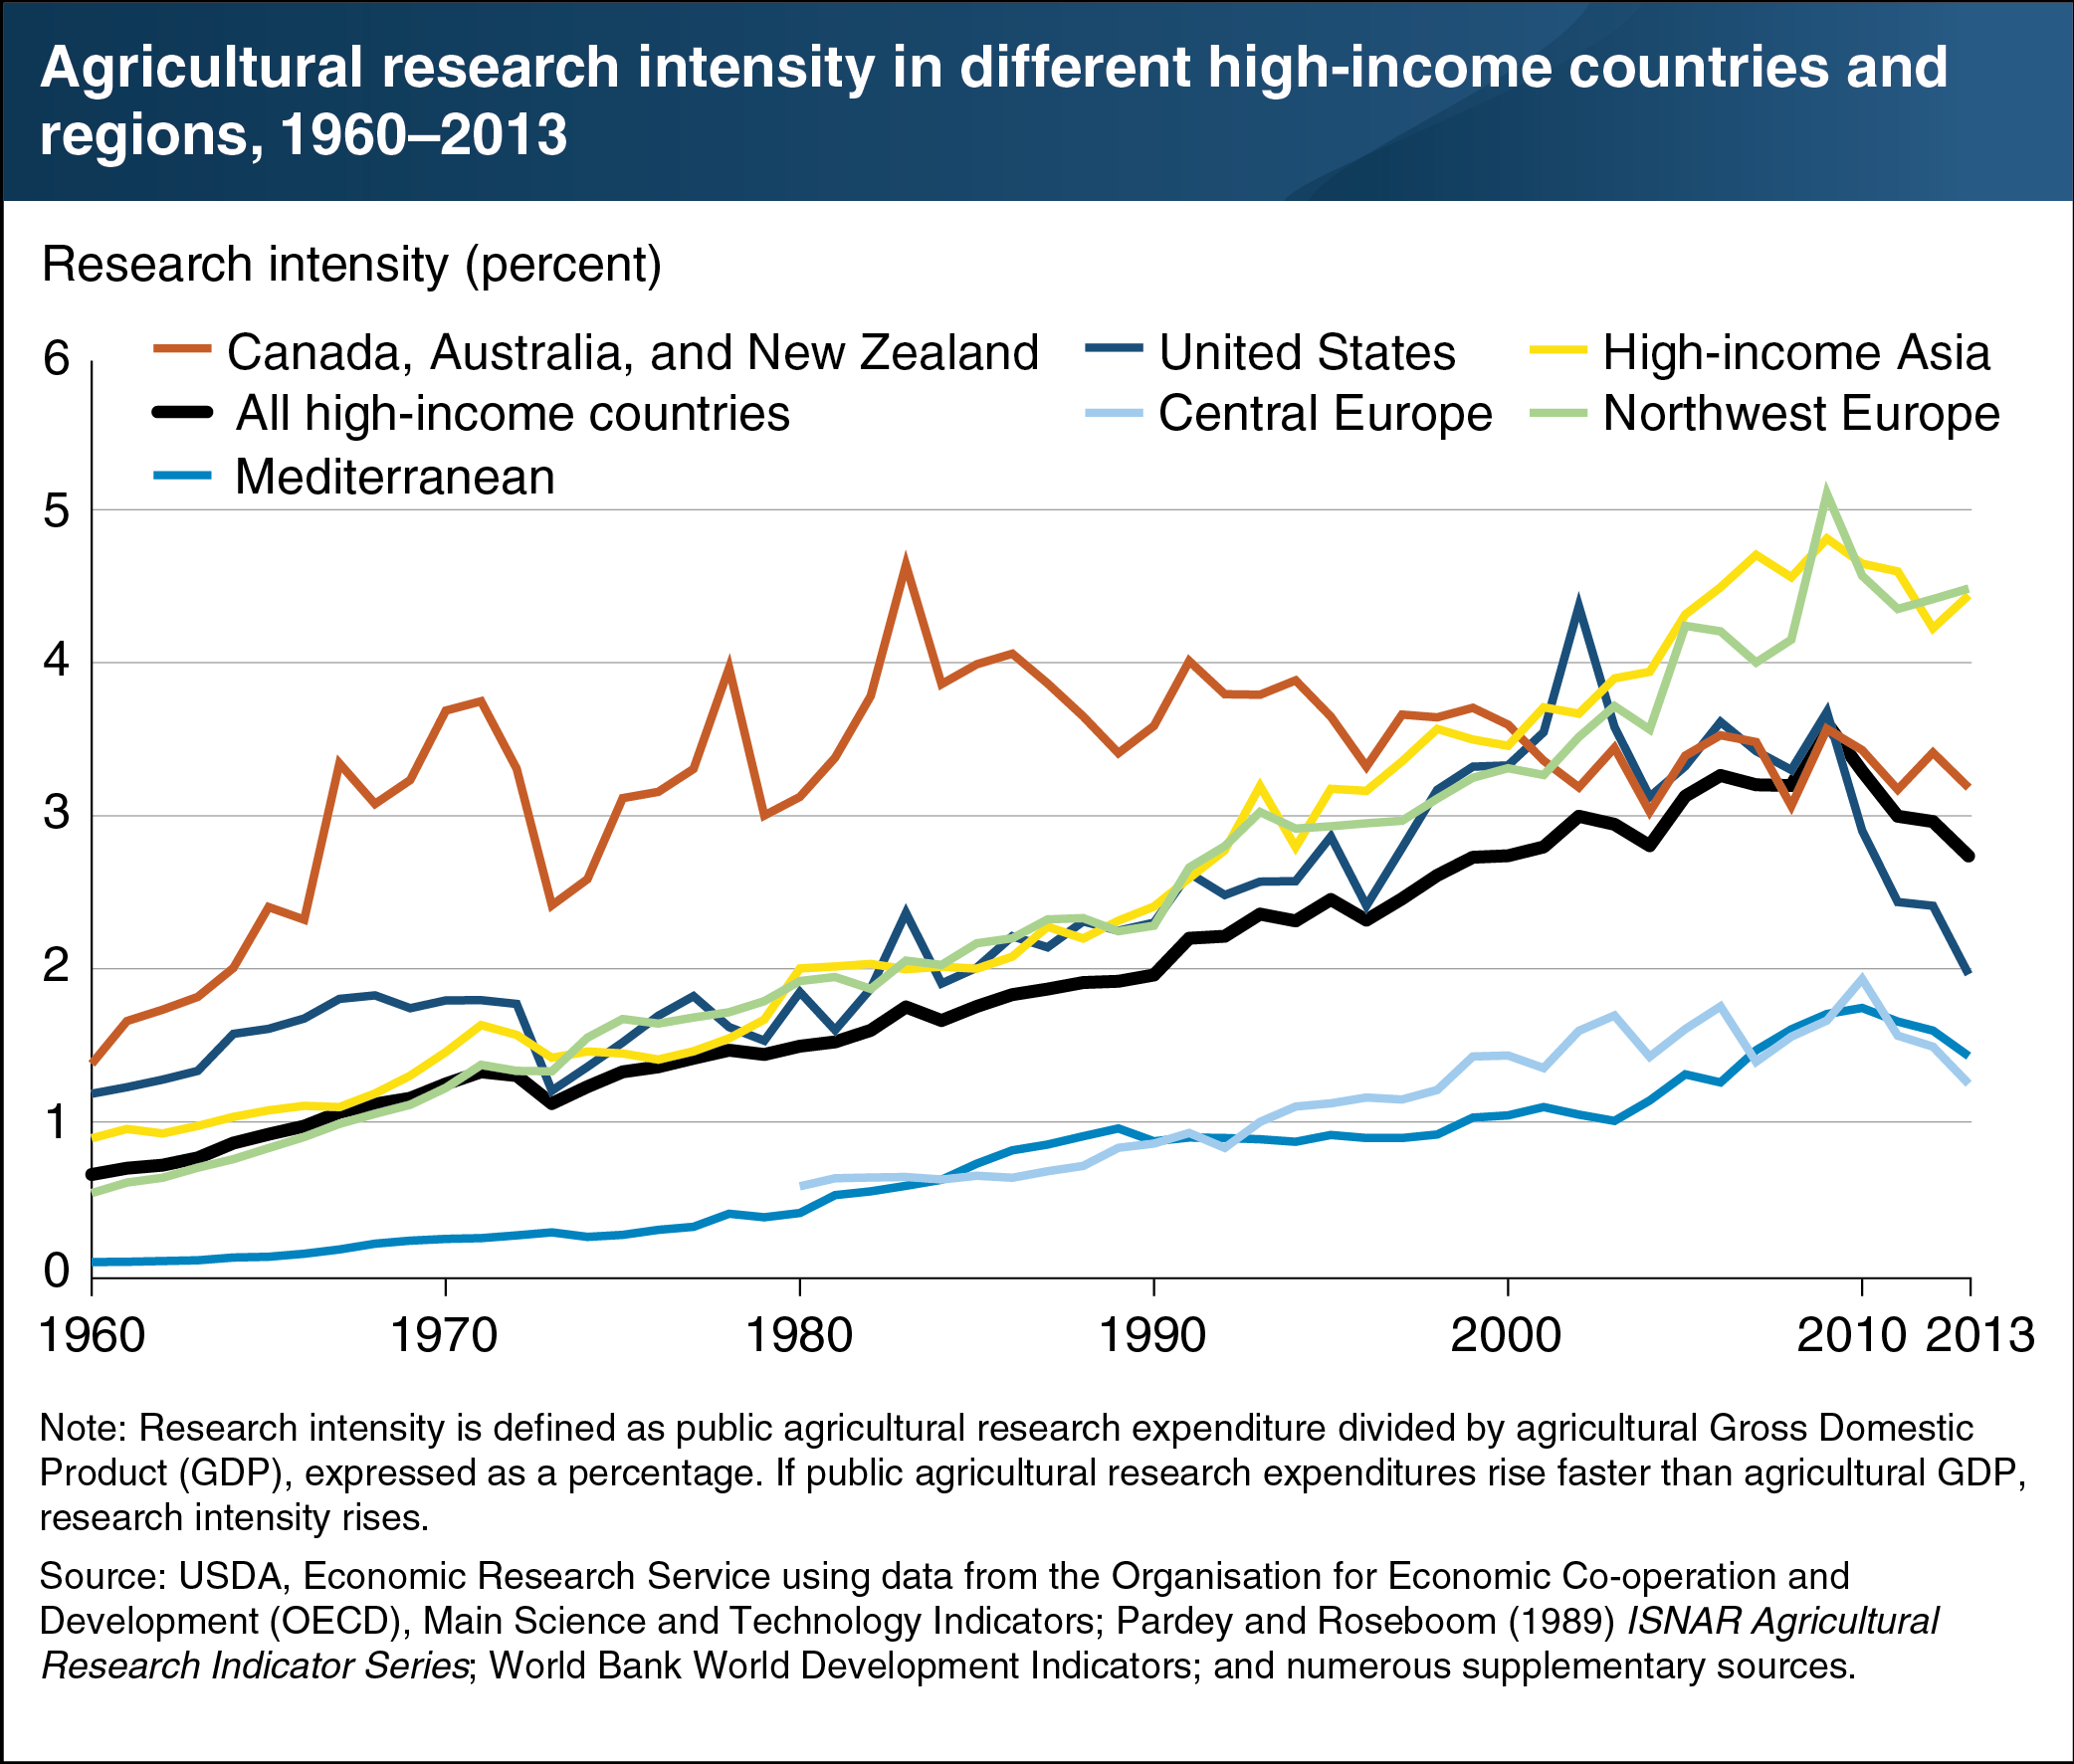
One way of comparing research and development (R&D) investment across countries is to measure R&D spending relative to the size of the economy, or as a percentage of Gross Domestic Product (GDP). While the United States spends more on public agricultural R&D than other high-income countries, U.S. expenditures relative to the size of its agricultural sector have been about average. Over time, agricultural R&D spending has tended to rise as a percentage of agricultural GDP in virtually all countries. This tendency reflects the greater technological sophistication of agriculture, as well as the broadening of research agendas beyond production agriculture to include more emphasis on various societal issues, including food safety, rural development, and the environment. In the United States, public spending on agricultural R&D as a percentage of GDP peaked in the mid-2000s at about 3.5 percent of agricultural GDP but significantly declined since 2009. By 2013, public spending fell to 2 percent of agricultural GDP. U.S. agricultural research intensity is now below average for high-income countries. Leading regions, such as Northwest Europe and high-income Asia, have agricultural R&D spending of around 4.5 percent of agricultural GDP. Public agricultural research intensities also leveled off or even fell in the agricultural-exporting countries of Canada, Australia, and New Zealand. Research intensities in Southern European and Mediterranean countries and in Central European countries have been consistently lower than those in other high-income countries. This chart appears in the ERS report, Agricultural Research Investment and Policy Reform in High-Income Countries, released May 2018.