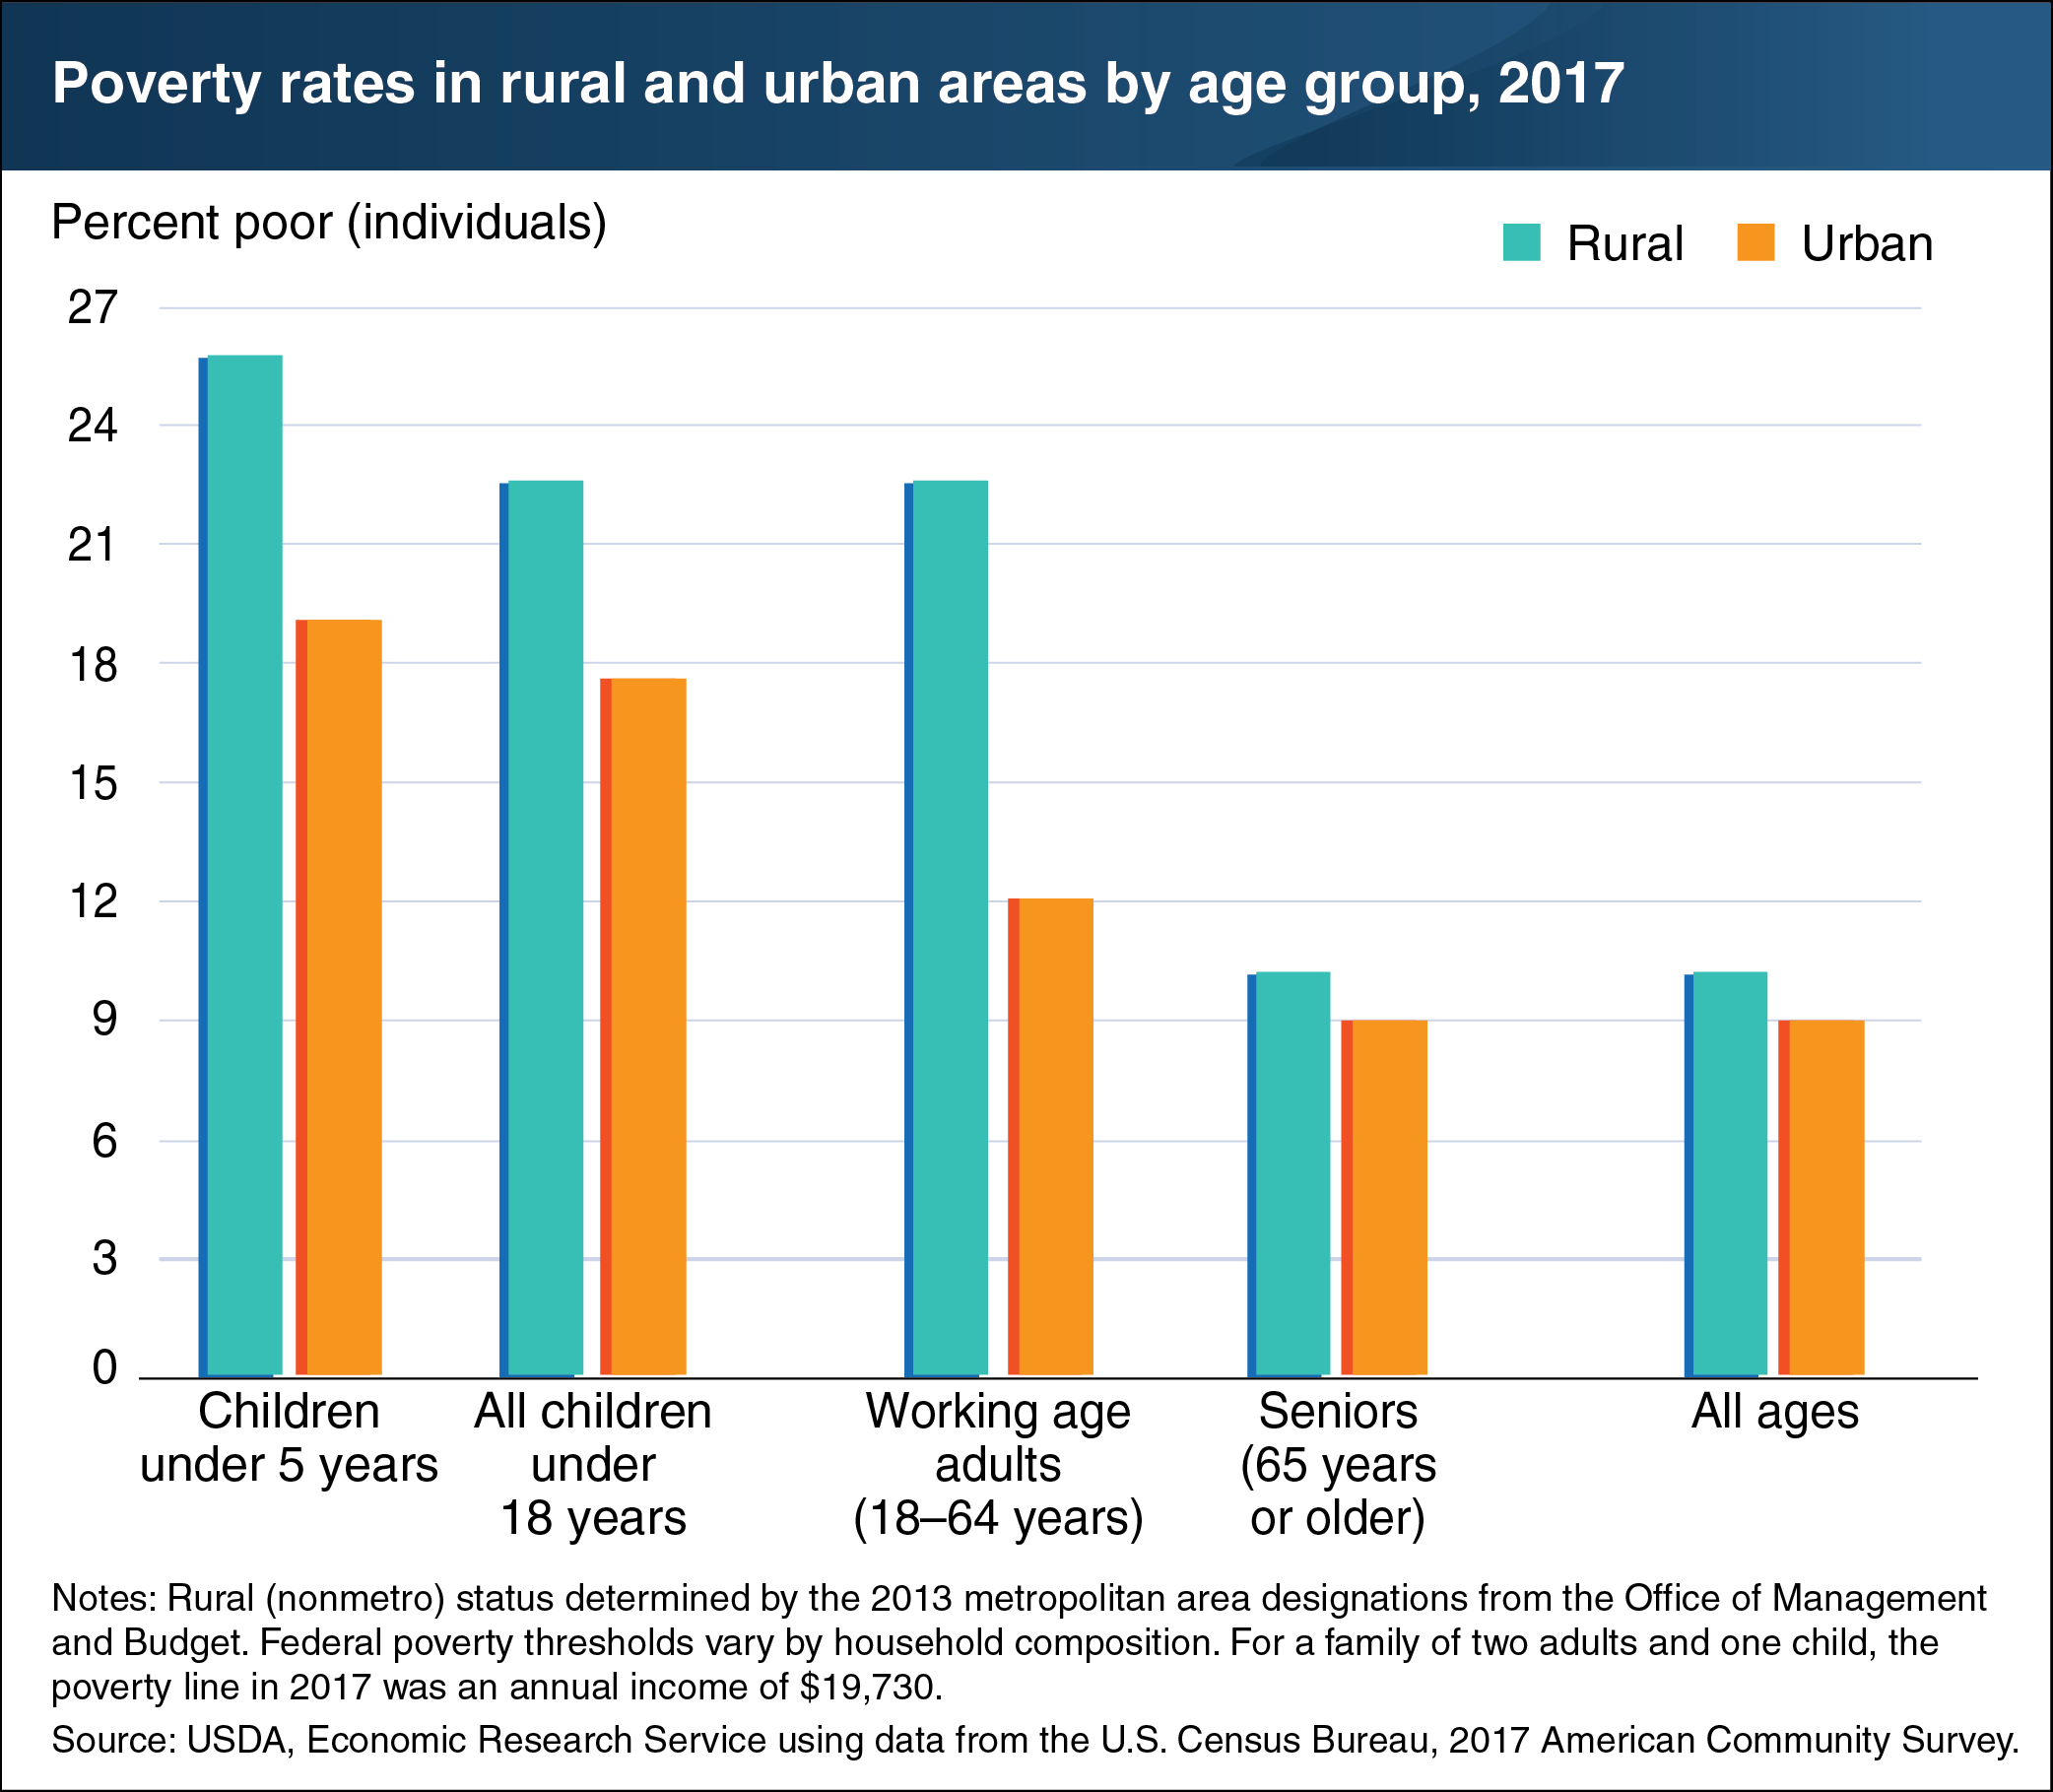
Poverty rates in 2017 were highest for children, particularly among those living in rural areas
- by Tracey Farrigan and Dennis Vilorio
- 11/4/2019

U.S. poverty rates differ by age group. In 2017, the difference between rural and urban poverty rates was greatest for children under the age of 5 (26.0 percent in rural areas versus 19.3 percent in urban areas). Federal poverty thresholds vary by household composition. For a family of two adults and one child, the poverty line in 2017 was an annual income of $19,730. Overall, child poverty rates under age 18 were 22.8 percent in rural areas and 17.7 percent in urban areas. In contrast, the poverty rates for senior adults (age 65 and older) were much closer at 10.1 percent in rural areas and 9.1 percent in urban areas. Working age adults (ages 18–64) followed the pattern of other age-groups, in that they had higher poverty rates in rural areas (16.0 percent) than in urban areas (12.1 percent). Poverty rates do not indicate how long individuals have experienced poverty. Some families cycle into and out of poverty over time, while others are persistently poor. Persistent poverty among children is of particular concern, as the cumulative effects may lead to poor health, limited education, and other negative outcomes. Also, research suggests that the more time a child spends in poverty or living in a high-poverty area, the greater the chance of being poor as an adult. This chart appears in the ERS topic page for Rural Poverty & Well-being, updated March 2019.


