
ICYMI... Inflation in grocery store food prices varies across U.S. metropolitan areas
- by Gianna Short and Katherine Ralston
- 9/24/2019
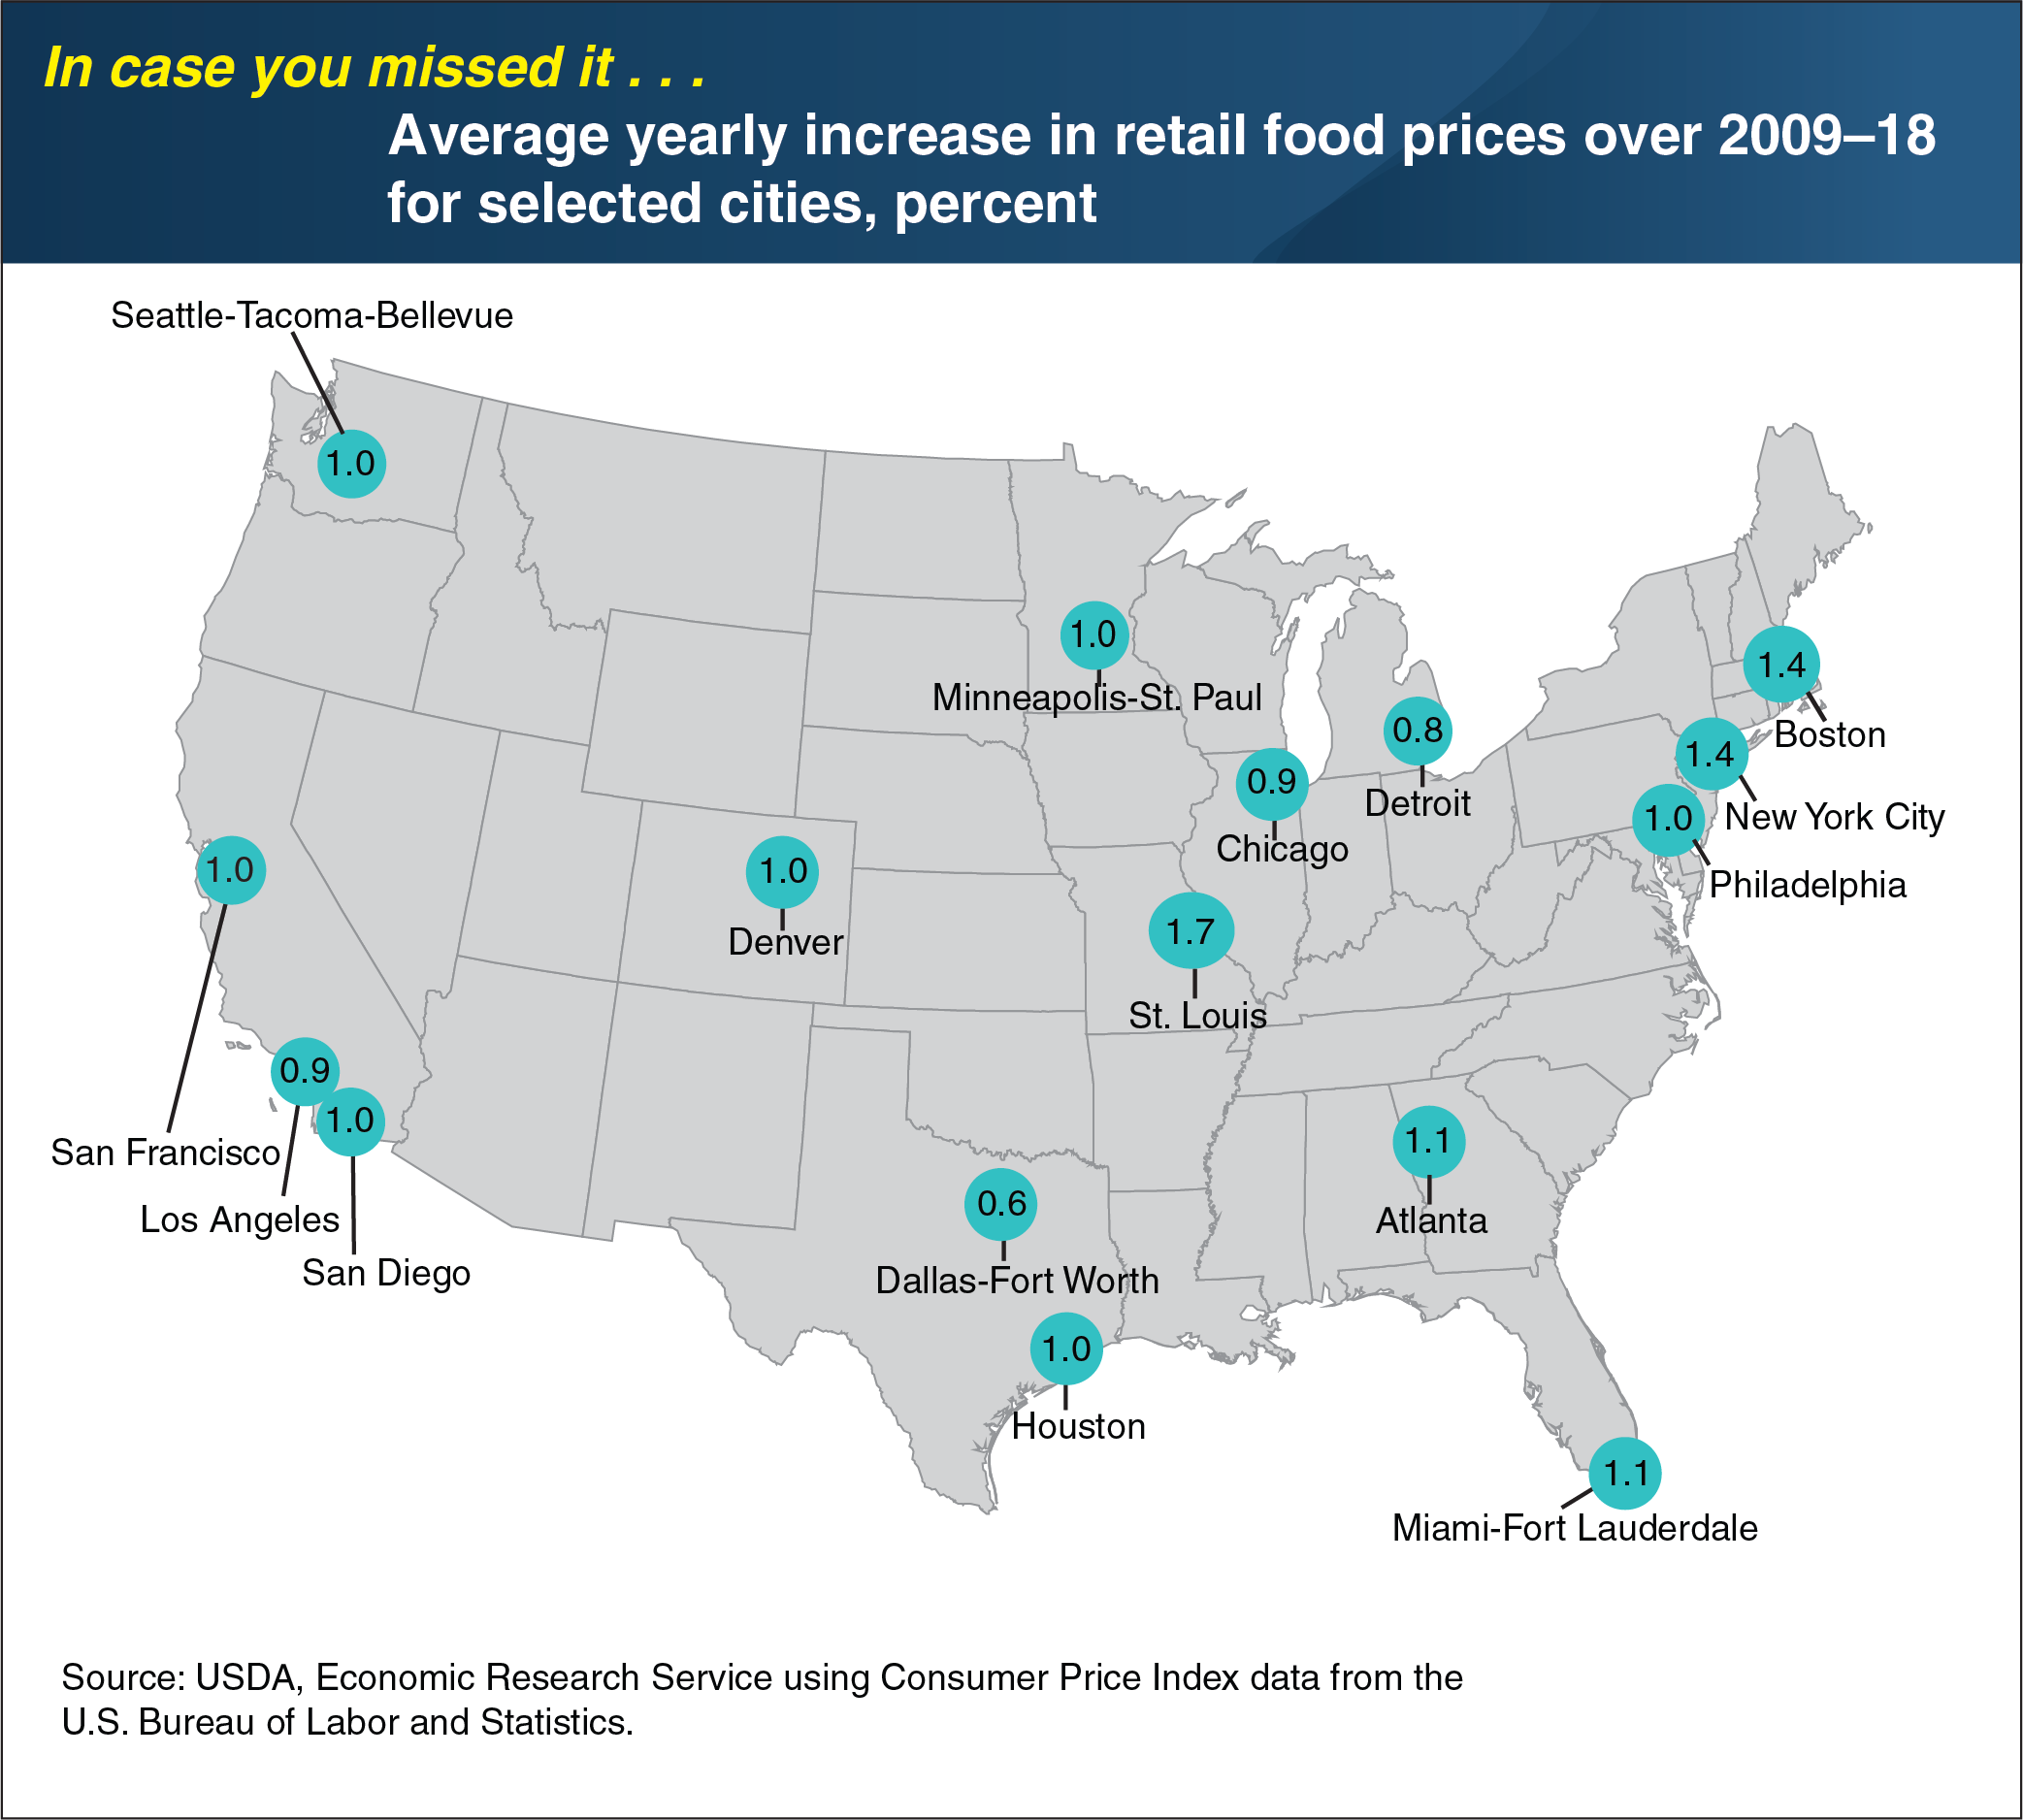
Between 2009 and 2018, retail food prices rose an average of 1.2 percent per year nationally. However, food-at-home price inflation varies by geographic location. Over the same 10-year period, retail food prices rose an average of 1.7 percent per year in St. Louis, while prices in Dallas rose on average 0.6 percent per year. Averaging 10 years of annual data smooths out year-to-year “noise”—volatile price swings that obscure the bigger picture of relative food price increases by city. Different rates of change in transportation costs and retail overhead expenses, such as labor and rent, can explain some of the variation among cities because cost increases are often passed along to the consumer in the form of higher grocery prices. Furthermore, differences in consumer food preferences among cities for specific foods may help explain variation in inflation rates. For example, a city whose residents strongly preferred foods with little price inflation (such as pork and poultry at 1.4 and 1.5 percent per year, respectively, in 2009–2018) might have had a lower 10-year average inflation level than a city whose residents purchased more beef or veal, which increased an average of 3.4 percent per year in 2009–2018. This chart appears in an ERS data visualization, Food Price Environment: Interactive Visualization, released March 2019. This Chart of Note was originally published March 28, 2019.
We’d welcome your feedback!
Would you be willing to answer a few quick questions about your experience?