
USDA commodity-income support levels have increasingly varied since 2015
- by David Boussios and Utpal Vasavada
- 8/19/2019
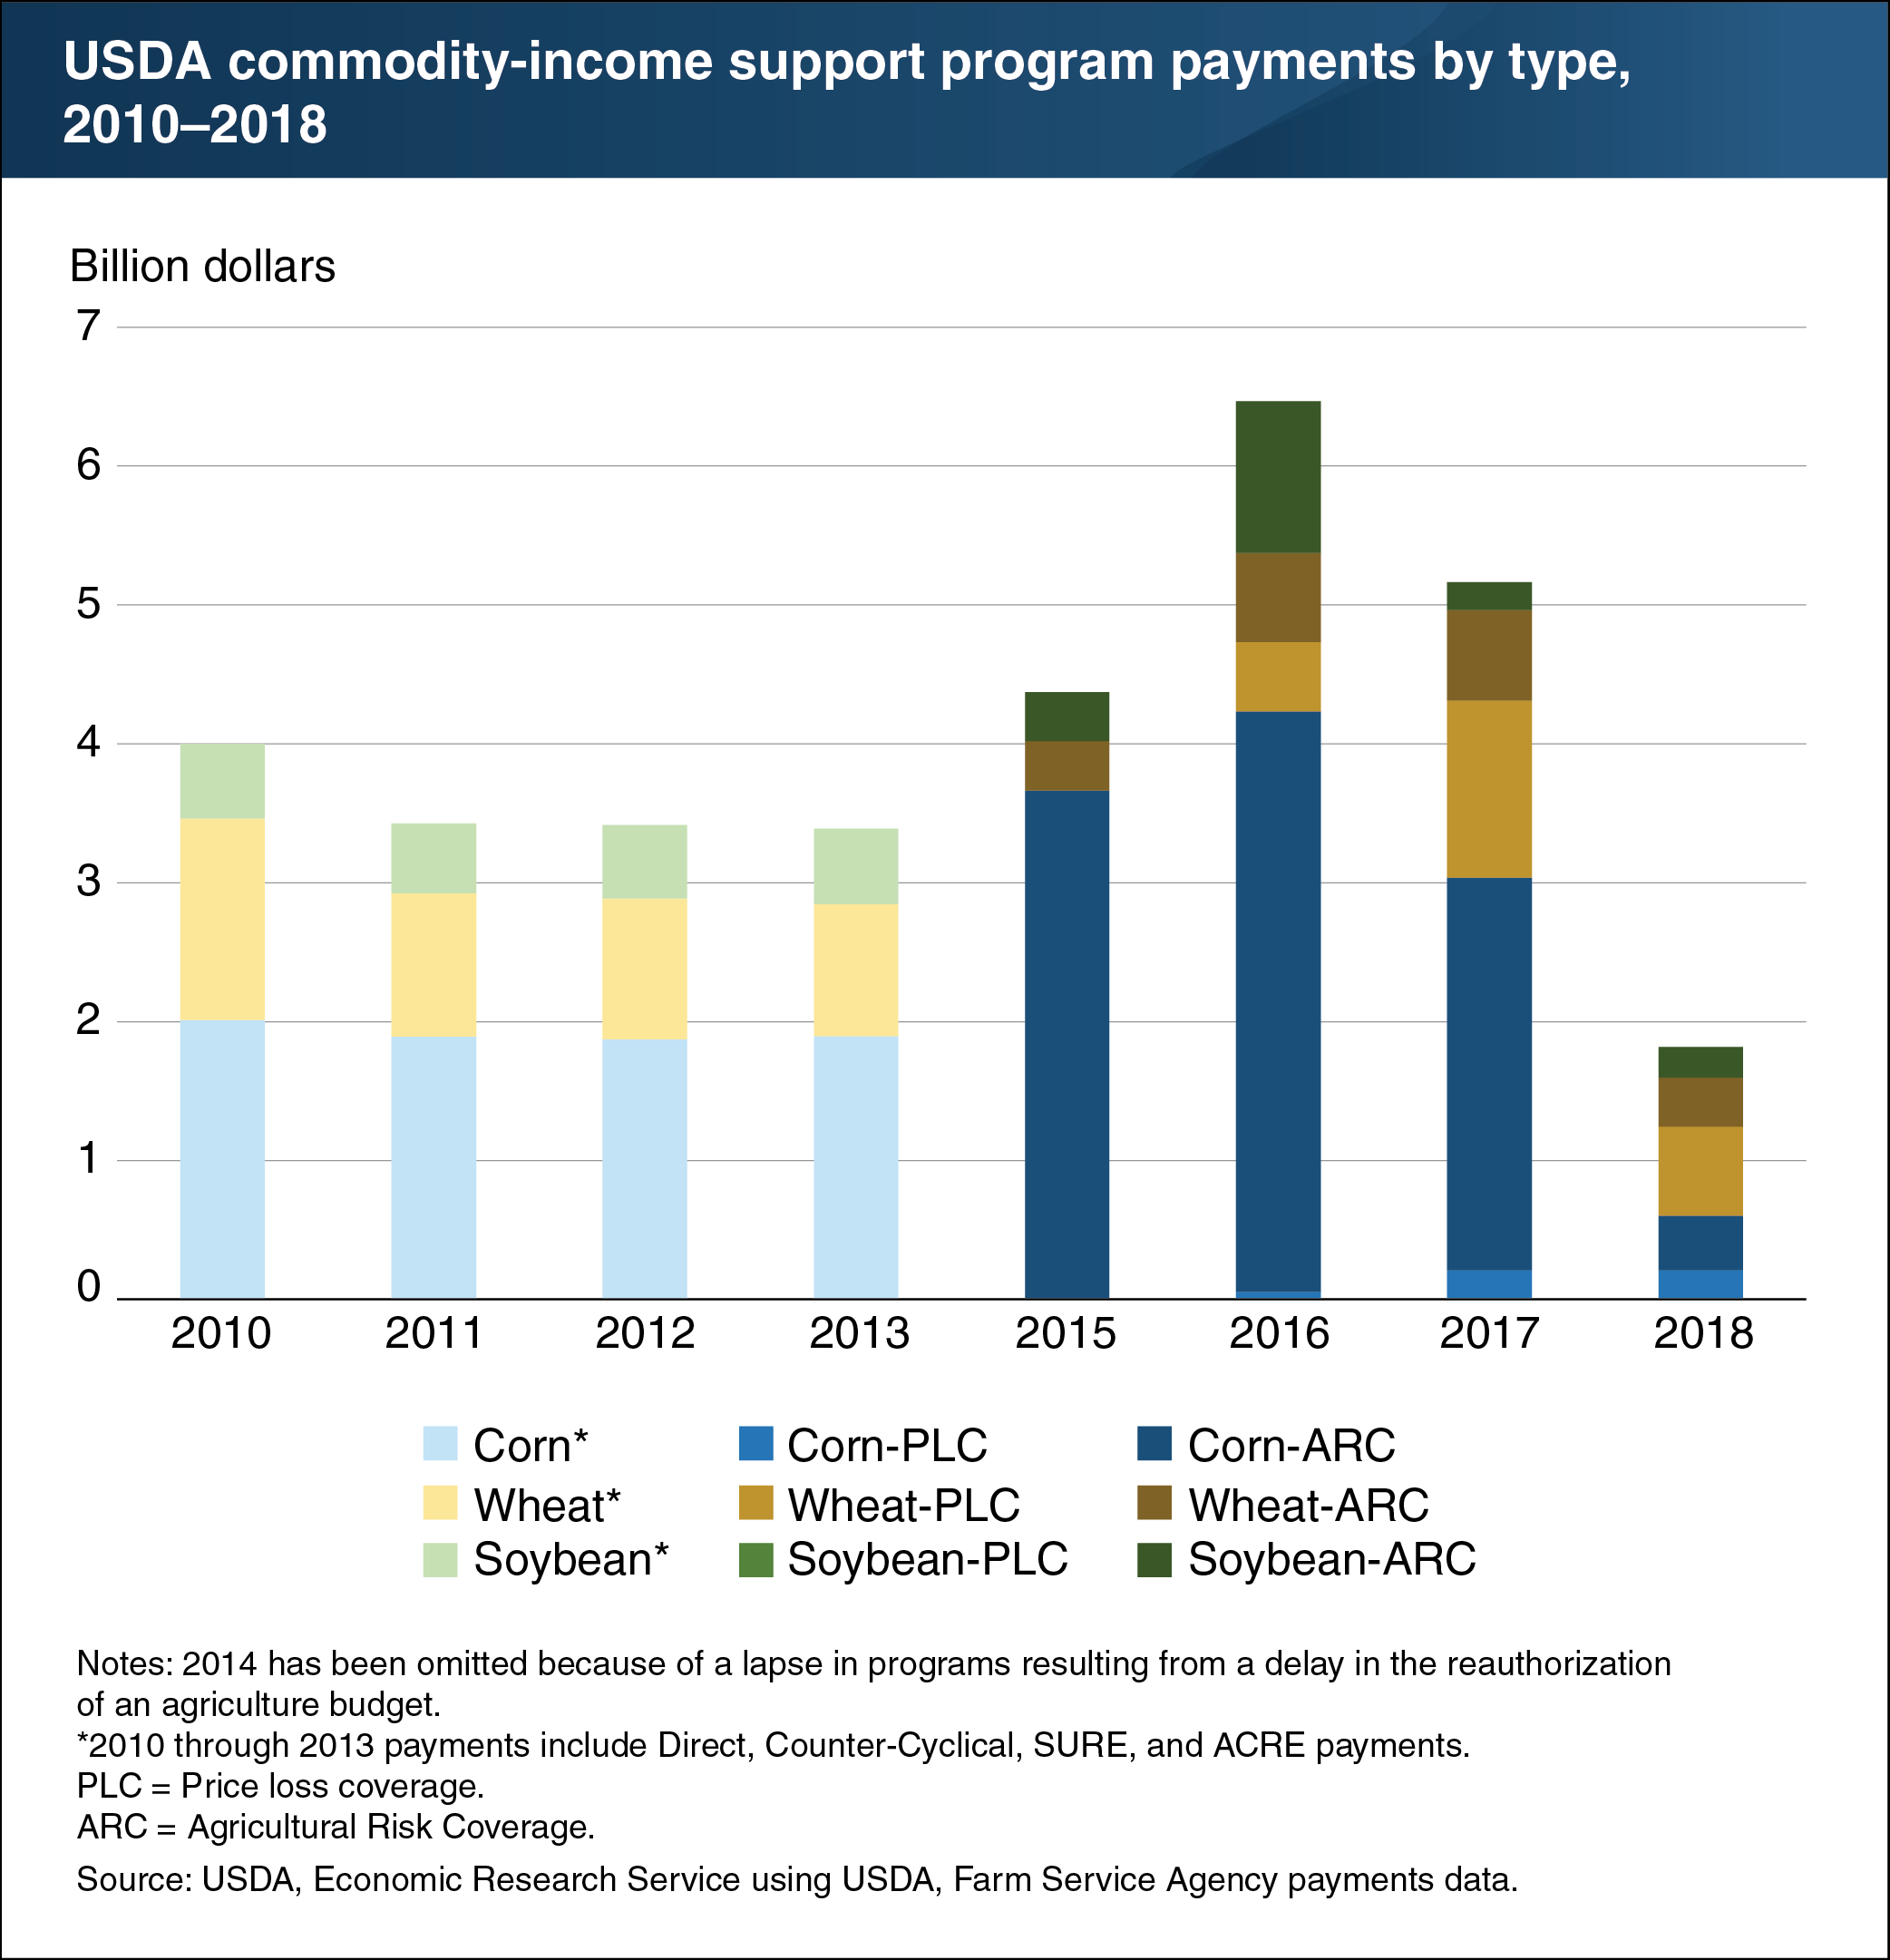
In the years leading up to 2015, USDA commodity-income support was predominantly from direct, unconditional payments, which paid farmers roughly the same amount each year. Although other conditional payment programs existed at the time, the rise in commodity market prices reduced the total amount of conditional payments paid by the U.S. Government. With mostly unconditional payment programs providing income support, payments remained reasonably constant across the years leading up to the 2014 farm bill. Under these unconditional programs, corn base acres received the largest amount of income support (larger than soybeans and wheat), in part because corn covered the largest number of acres. The 2014 farm bill created two new conditional programs called Agricultural Risk Coverage (ARC) and Price Loss Coverage (PLC). Under these programs, farmers receive commodity-crop income support only if revenues or prices fall below predetermined thresholds. The creation of ARC and PLC, in combination with a decline in prices from 2012 peaks, has increased the variability of payments in recent years. For example, in 2016, the combined expenses across these three crops and two programs was $6.6 billion. Just 2 years later in 2018, this number decreased by $4.7 billion to $1.8 billion. This chart appears in the August ERS Amber Waves article, “Changes in Commodity-Income Support Programs and Commodity Prices have Caused Increased Variability in Support Payments.”
We’d welcome your feedback!
Would you be willing to answer a few quick questions about your experience?