
SNAP participation and benefits grew rapidly during and after the Great Recession
- by John Pender and Young Jo
- 6/20/2019
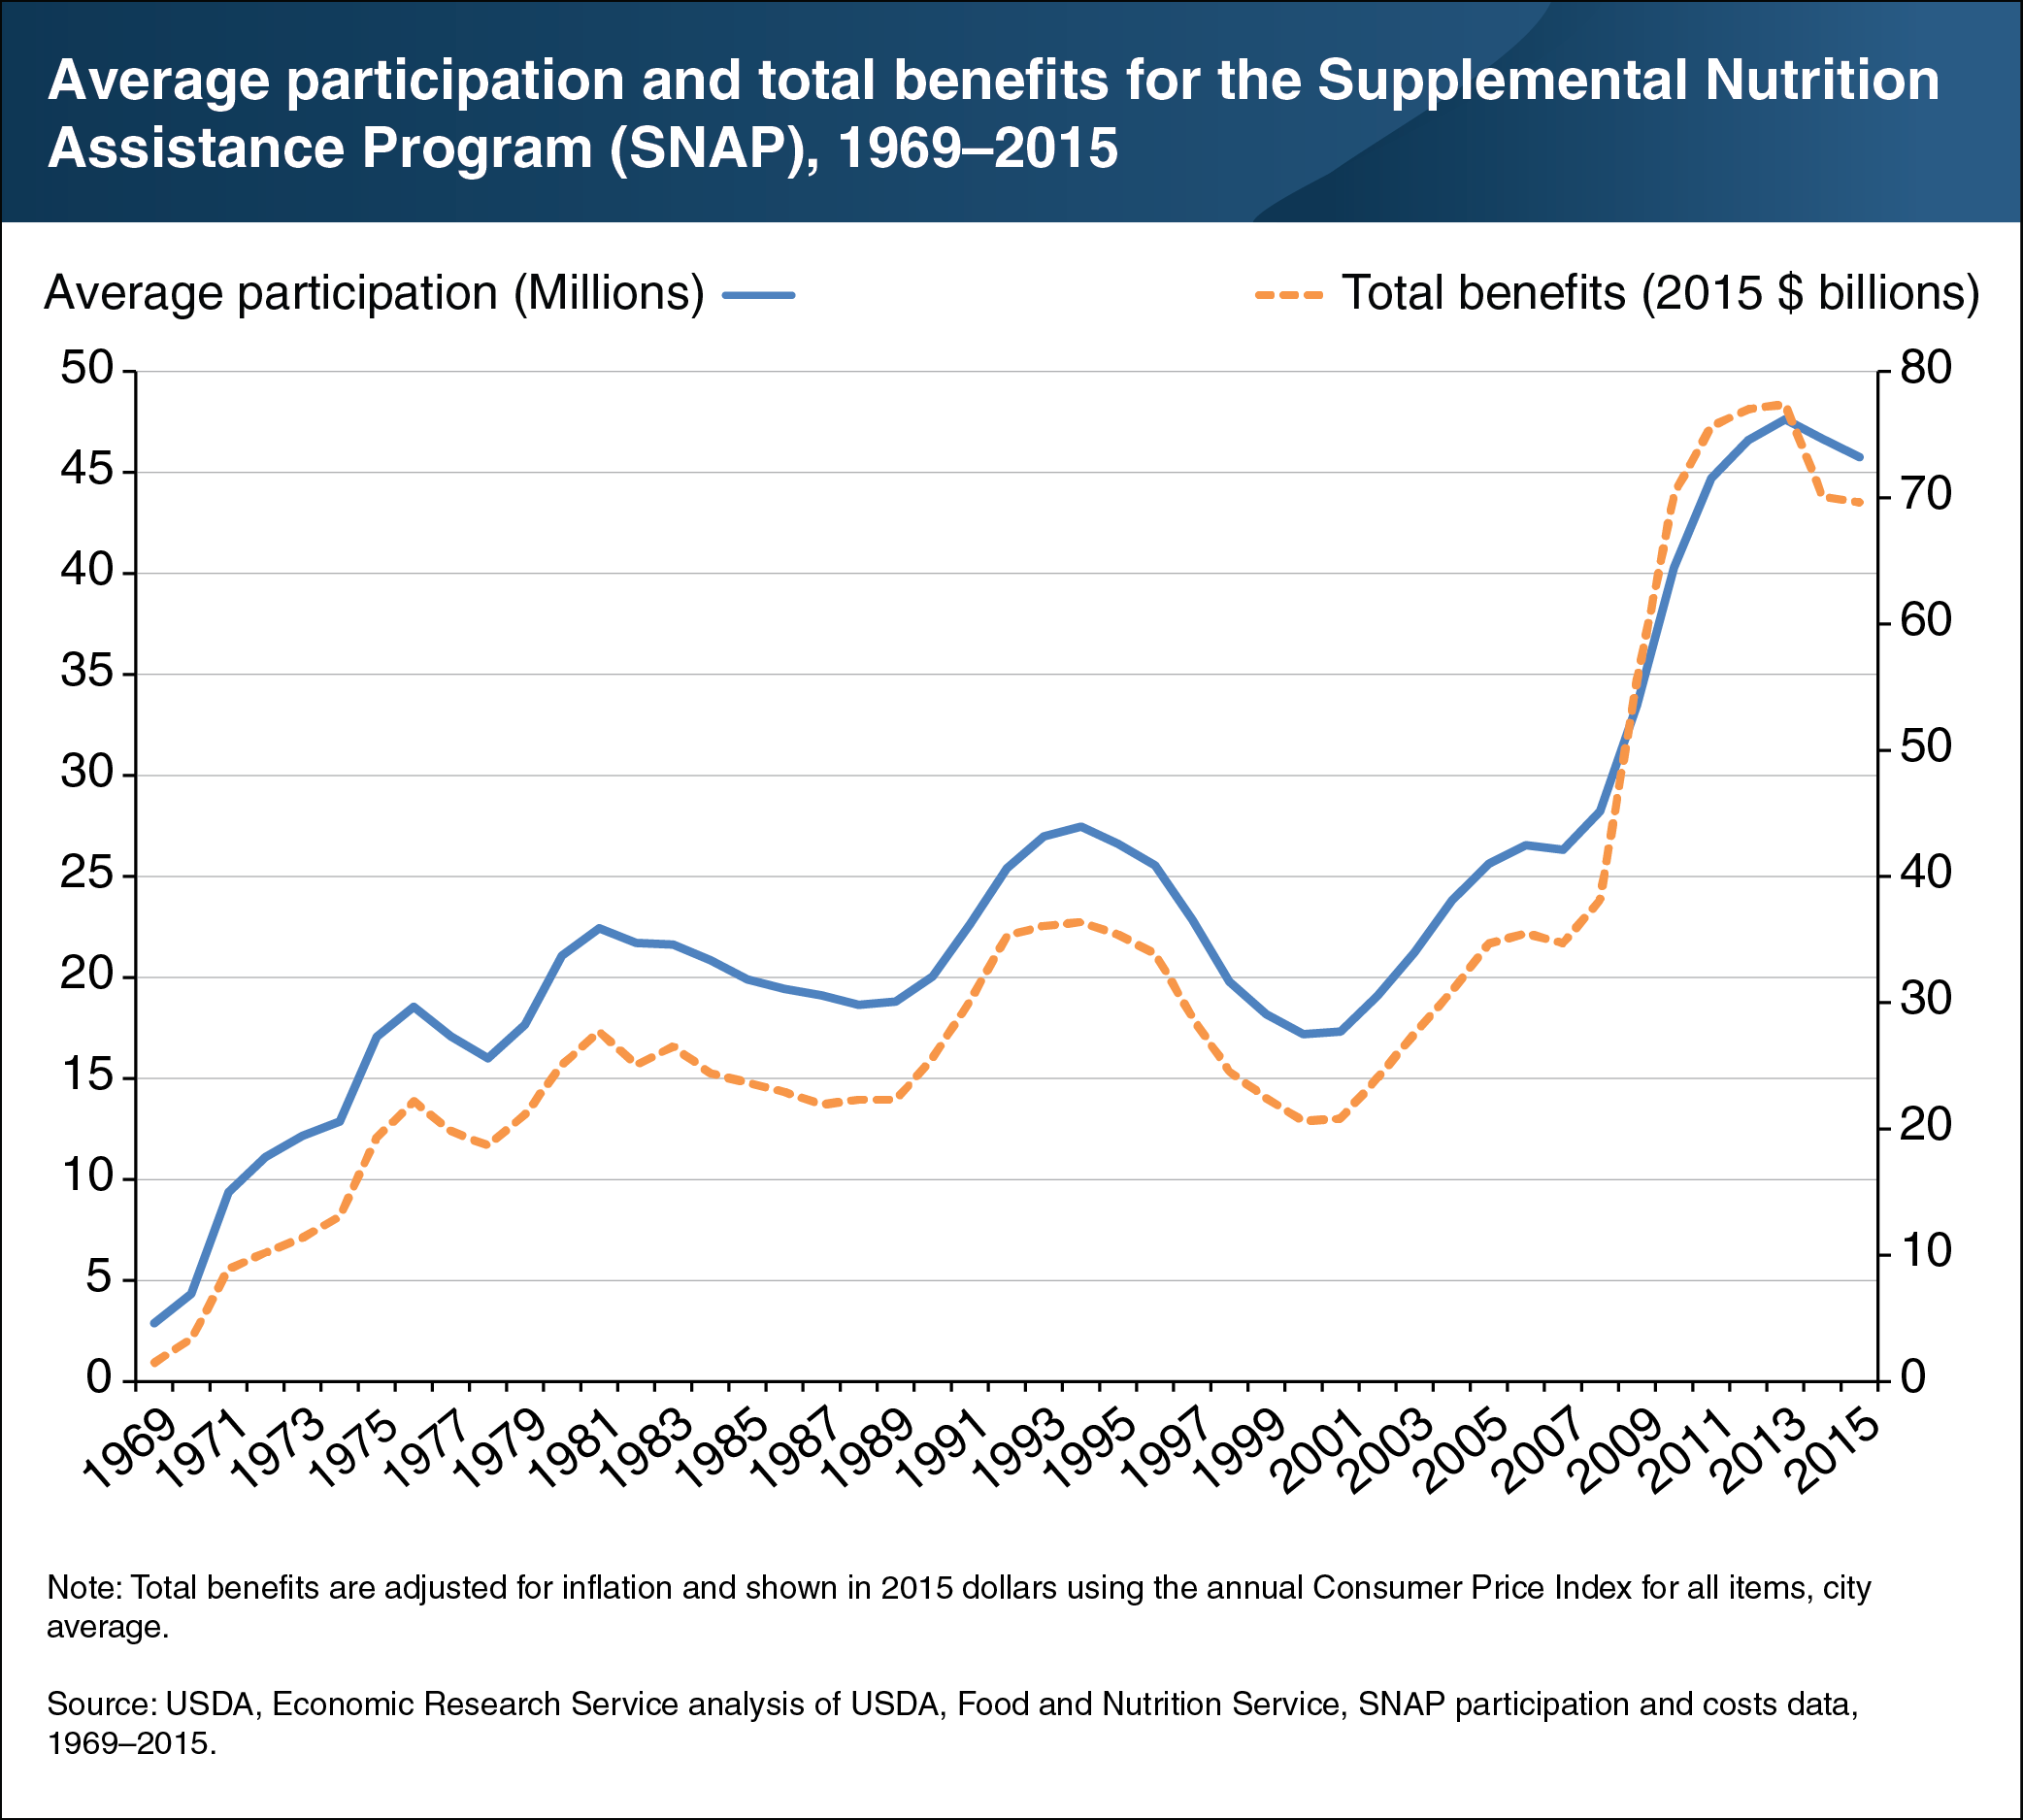
The Supplemental Nutrition Assistance Program (SNAP) is the largest USDA program. During fiscal year 2014, it provided benefits to an average of more than 46 million recipients per month and accounted for 52 percent of USDA’s spending. That year, SNAP recipients redeemed more than $69 billion worth of benefits at SNAP-authorized stores—83 percent of which were located in urban areas and 17 percent in rural areas. Between fiscal years 2000 and 2013, average monthly SNAP participation nearly tripled, while the inflation-adjusted value of benefits paid under the program nearly quadrupled. The growth in program participation and the value of benefits paid were particularly rapid during and immediately after the Great Recession, which officially began in December 2007 and ended in June 2009. However, the recession resulted in high poverty rates well after it officially ended. The increase in program spending between 2009 and 2013 was due in part to rising SNAP participation in response to high levels of poverty during this period. A temporary increase in benefit rates mandated by the American Recovery and Reinvestment Act (ARRA) in early 2009 and other policies to increase access to the program also likely expanded SNAP participation and spending. This chart appears in the May 2019 ERS report Investigating Impacts of SNAP Redemptions on County-Level Employment. Also see the May 2019 article, “SNAP Redemptions Contributed to Employment During the Great Recession” in ERS’s Amber Waves magazine.