

U.S. shellfish availability more than doubled from 1970 to 2016
- by Jeanine Bentley
- 5/10/2019
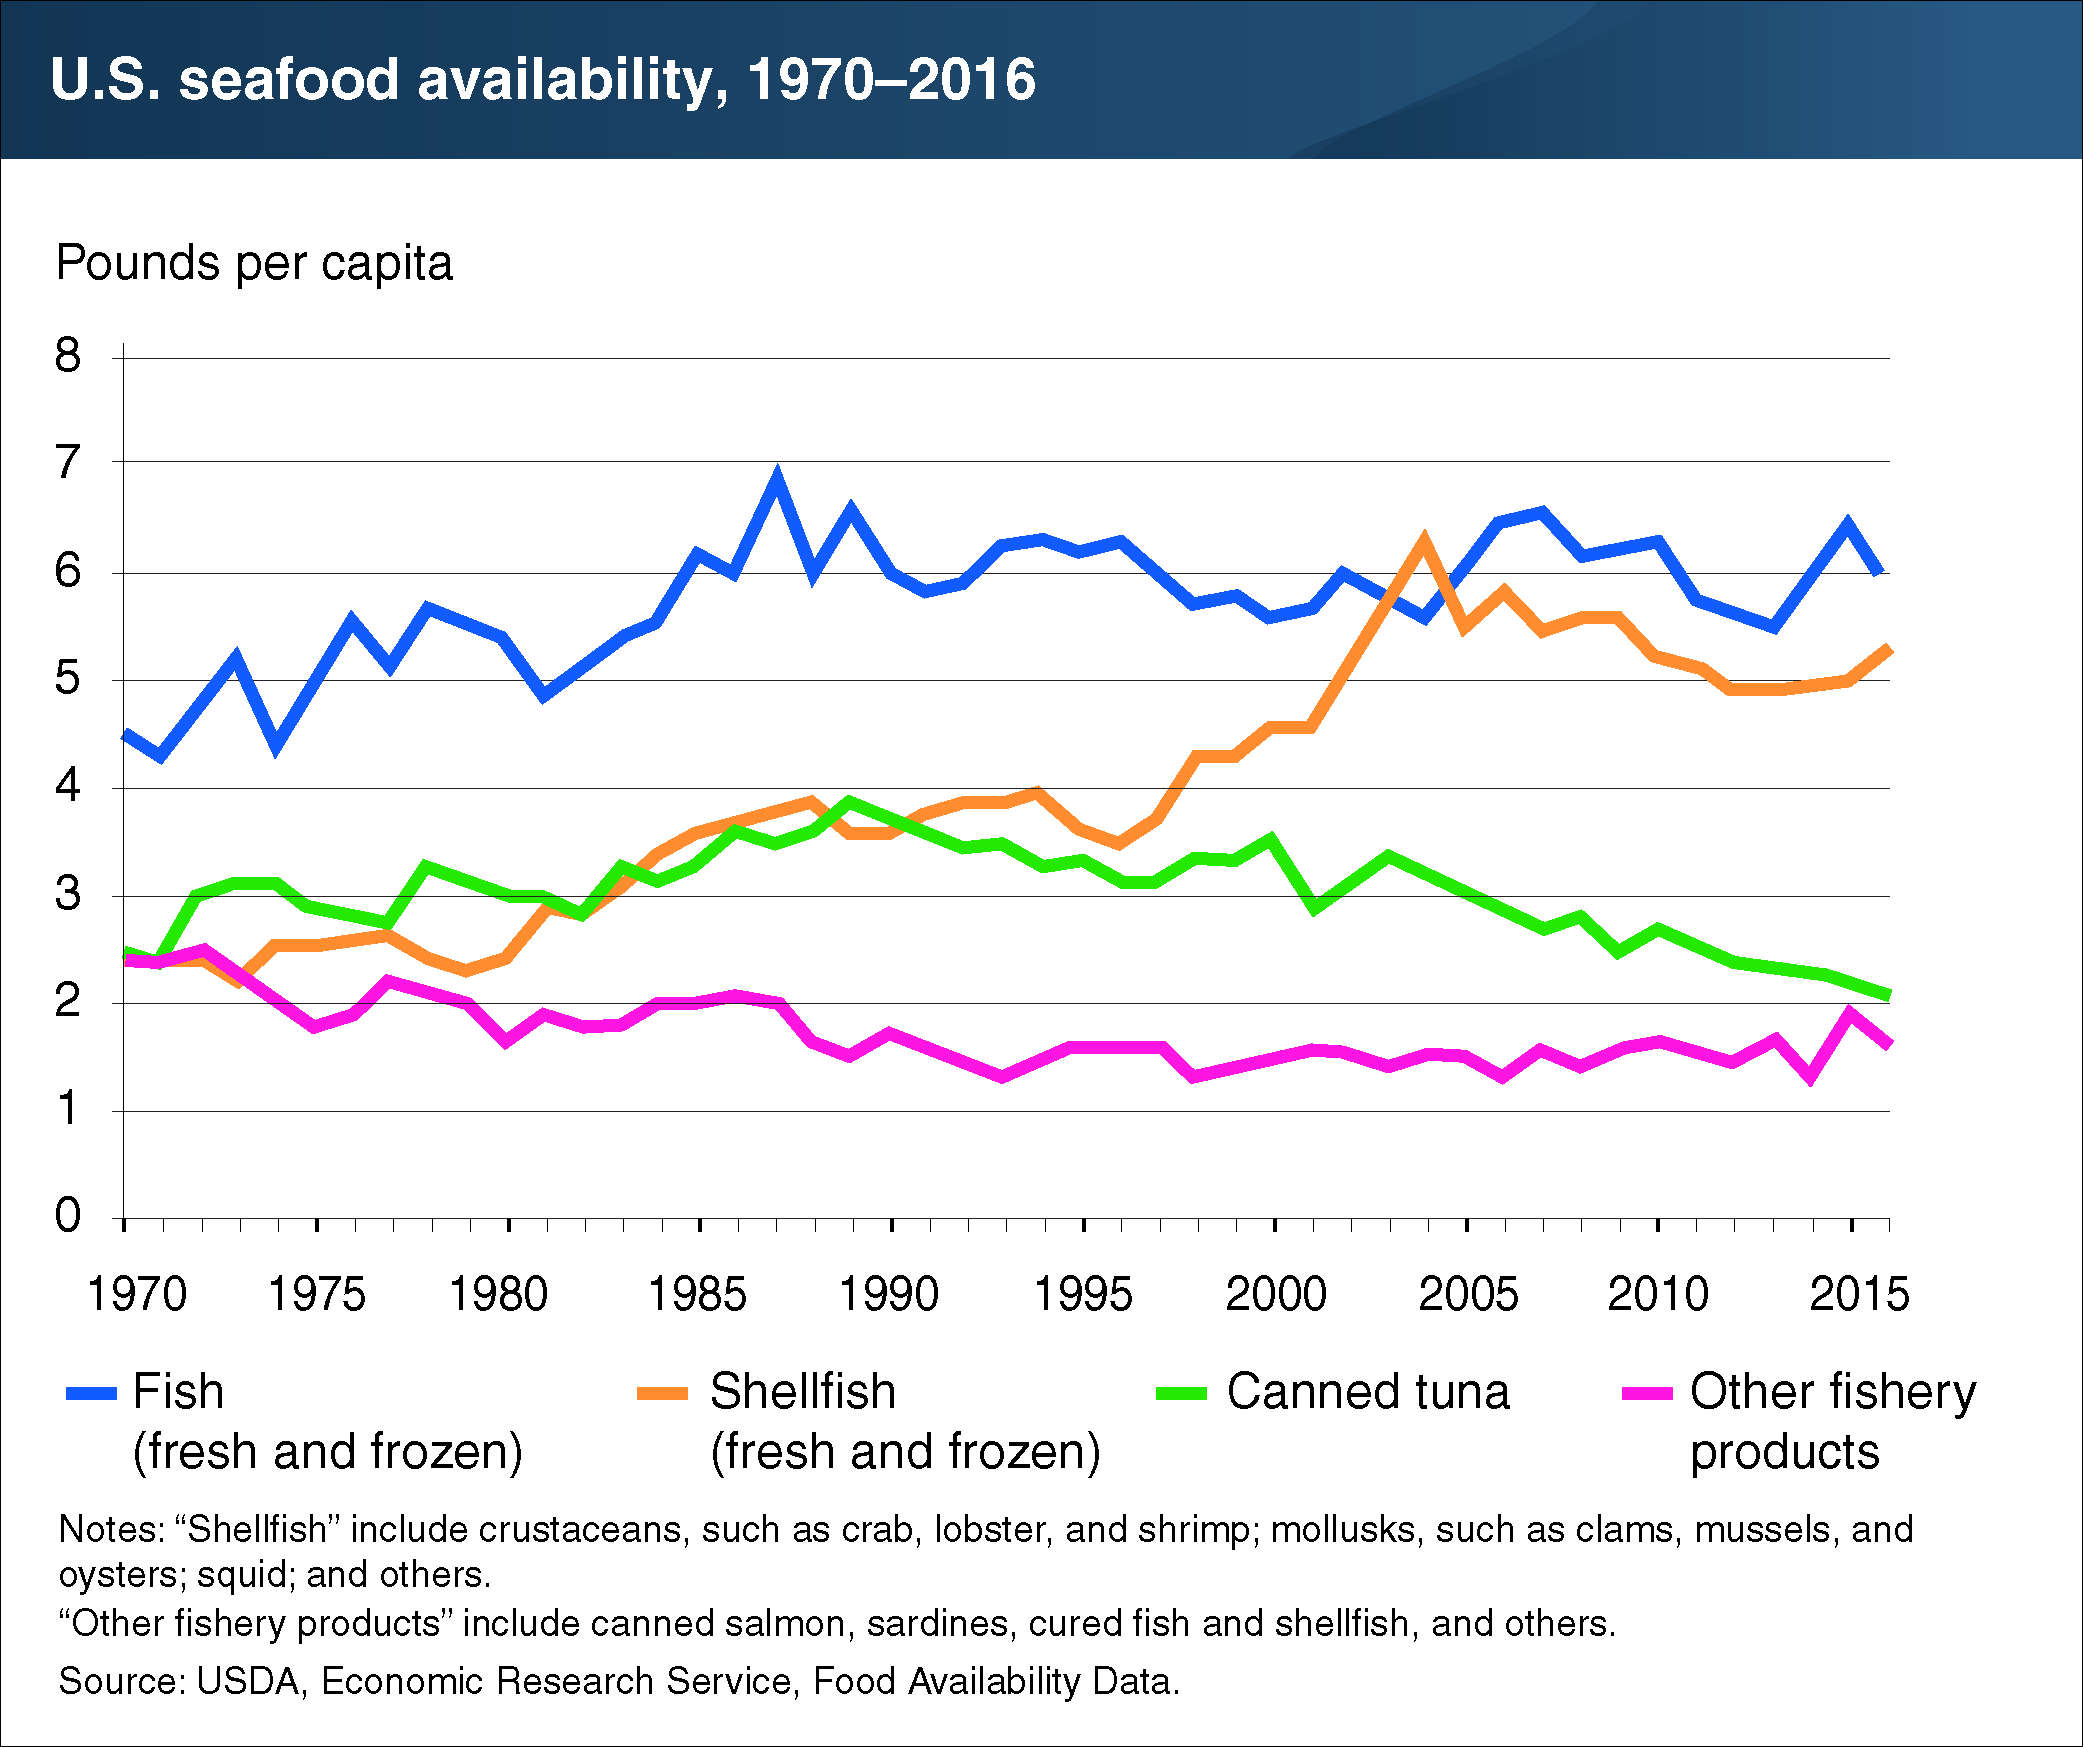
Low in calories and saturated fat, and rich in omega-3 fatty acids, seafood is a nutrient-dense source of dietary protein. In 2016, 15 pounds per person of seafood products were available for consumption in the United States, an increase from 11.7 pounds per person in 1970. In 2016, the category with the greatest availability was fresh and frozen fish at 6 pounds per person, followed by fresh and frozen shellfish at 5.3 pounds per person, which more than doubled since 1970. These two seafood categories together accounted for 76 percent of fishery product availability in 2016. Fresh and frozen shellfish availability has steadily increased over the past four and a half decades, surpassing canned tuna in 1991. The third highest seafood product, canned tuna, fell to 2.1 pounds per person in 2016 after reaching almost 4 pounds per person in 1989. Availability of the remaining canned and cured seafood products was 1.6 pounds per person in recent years down from a high of 2.5 pounds per person in 1972. The data for this chart come from the Food Availability data series in ERS’s Food Availability (Per Capita) Data System.