

AW2019_03_Finding_fig1_No_till_and_strip_till01
- by Roger Claassen
- 3/13/2019
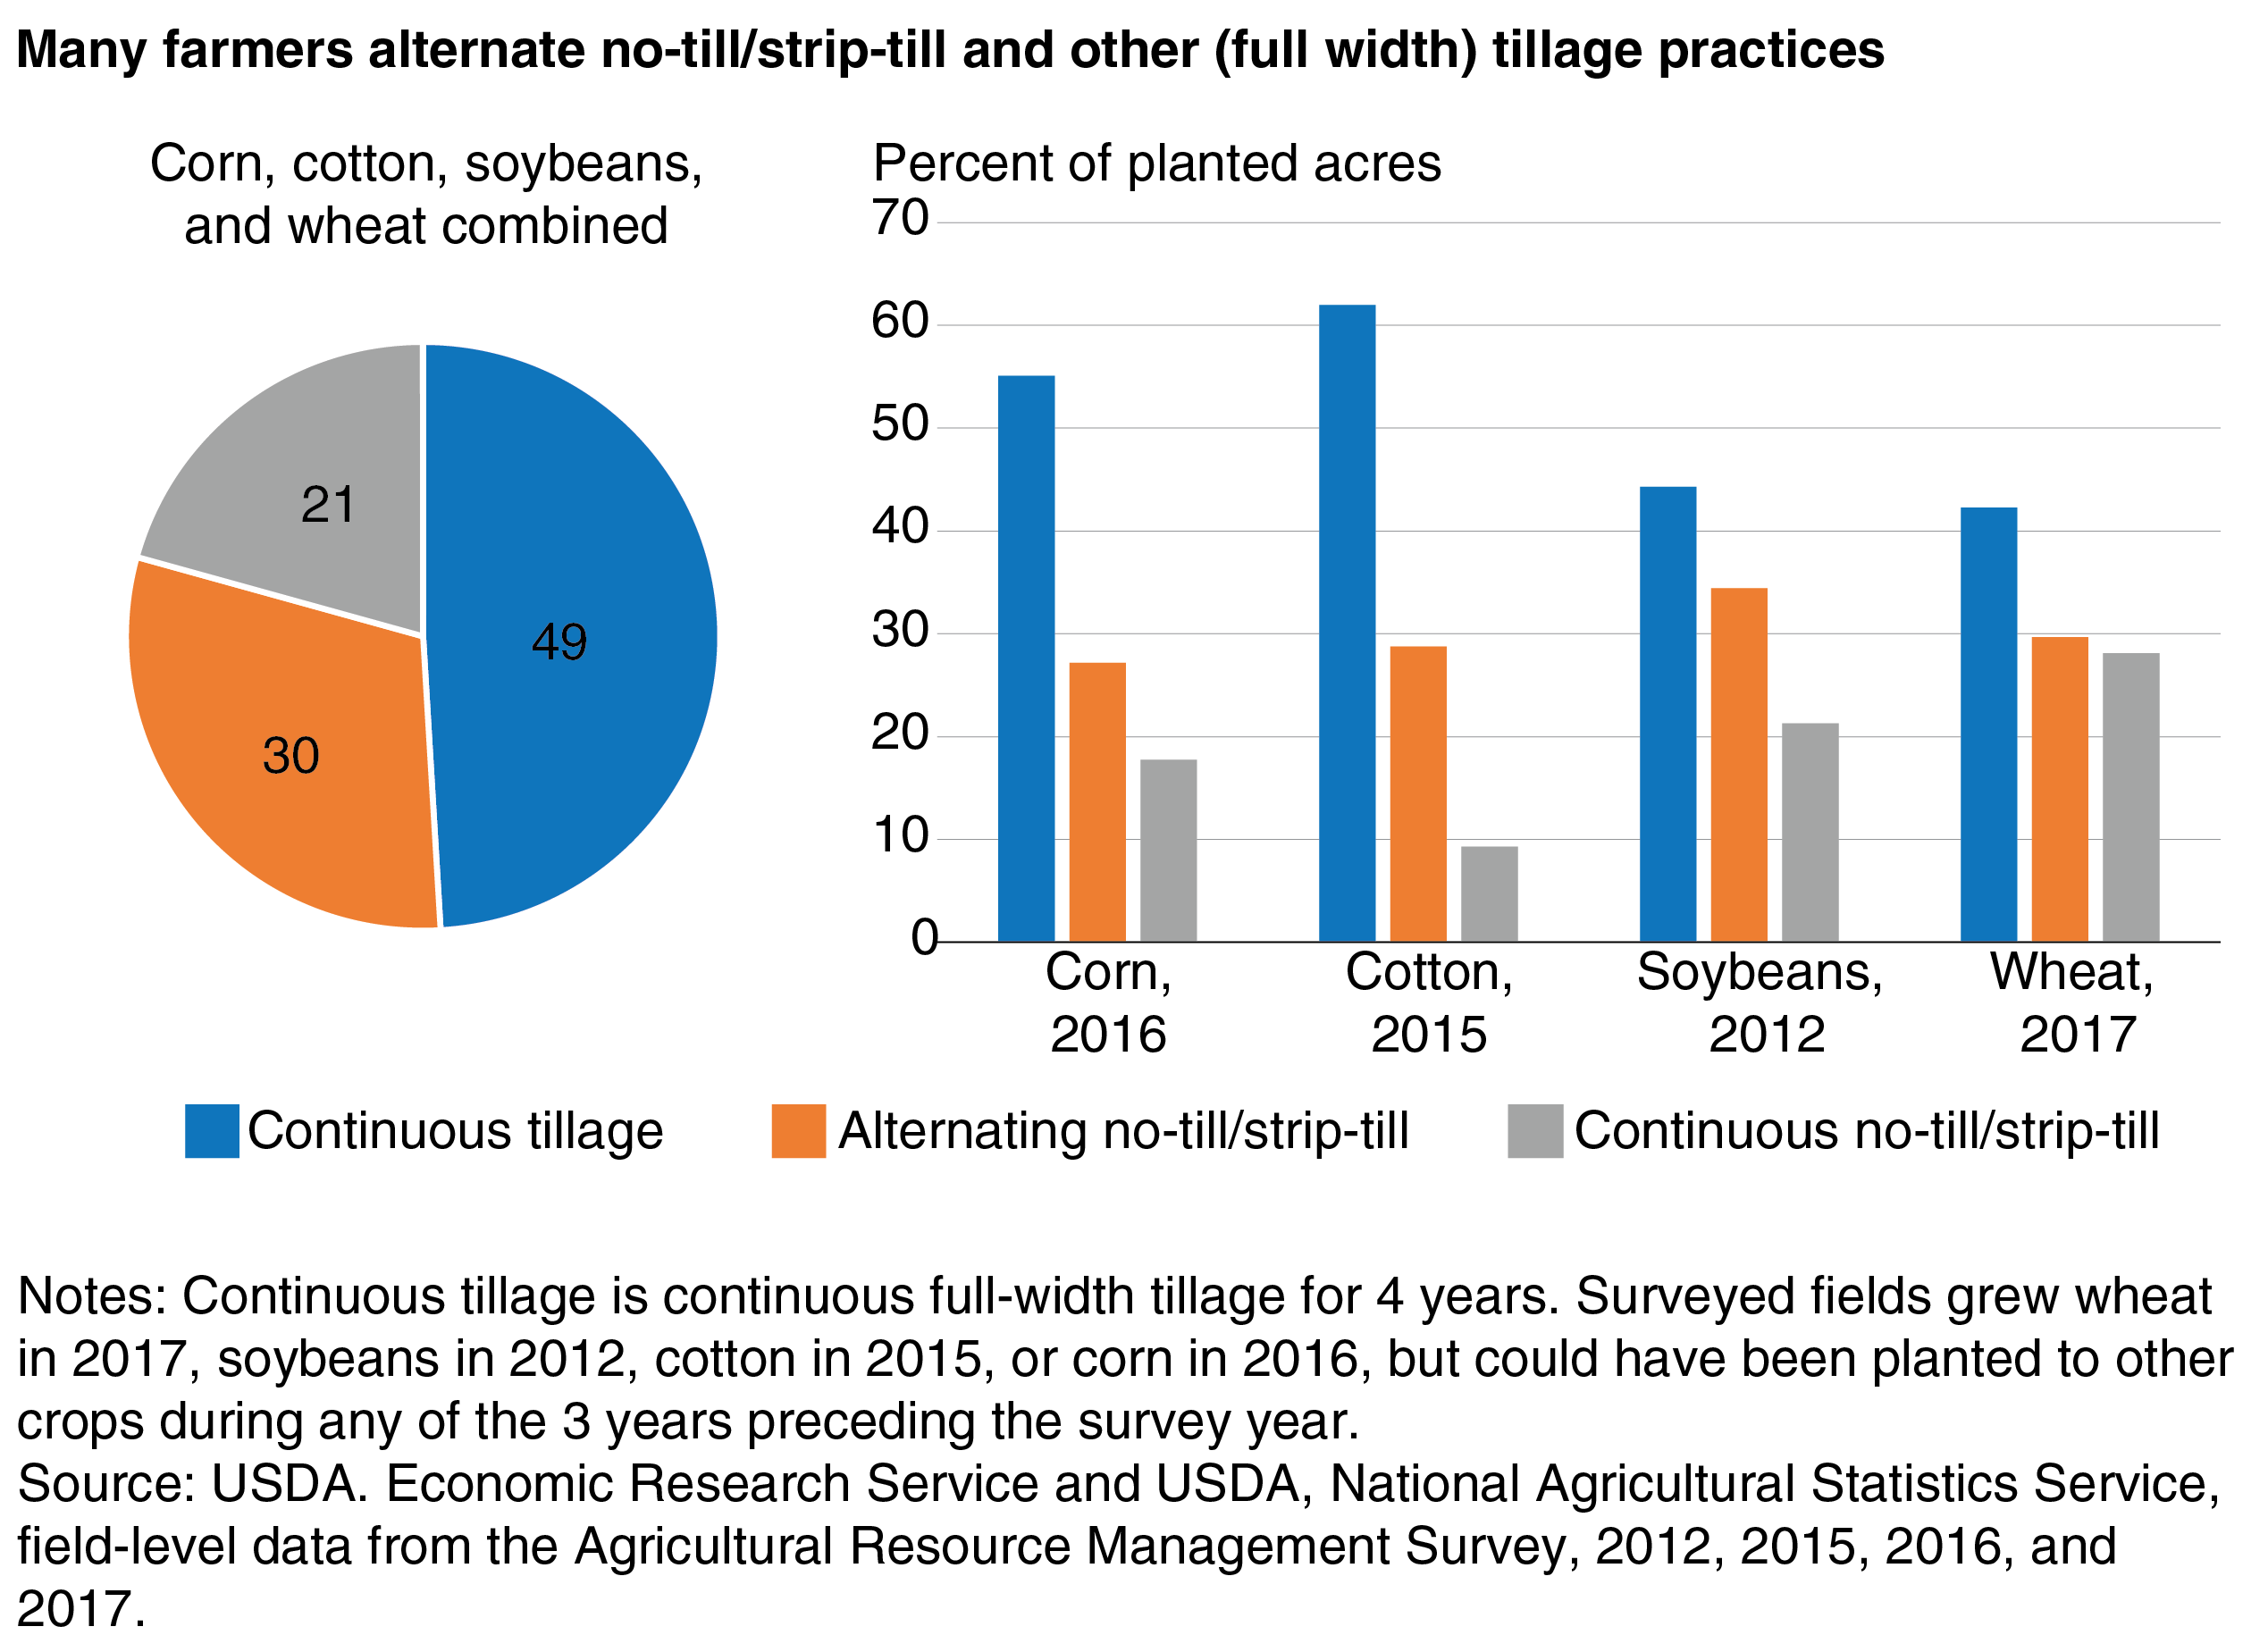
Many farmers alternate between no-till/strip-till and other (full width) tillage practices
Official websites use .gov
A .gov website belongs to an official government organization in the United States.
Secure .gov websites use HTTPS
A lock (
) or https:// means you’ve safely connected to the .gov website. Share sensitive information only on official, secure websites.
Many farmers alternate between no-till/strip-till and other (full width) tillage practices