

Since the burgeoning of the international avocado trade, U.S. avocado production is highest from April to July, when imports from Mexico abate somewhat
- by Steven Zahniser
- 10/24/2018
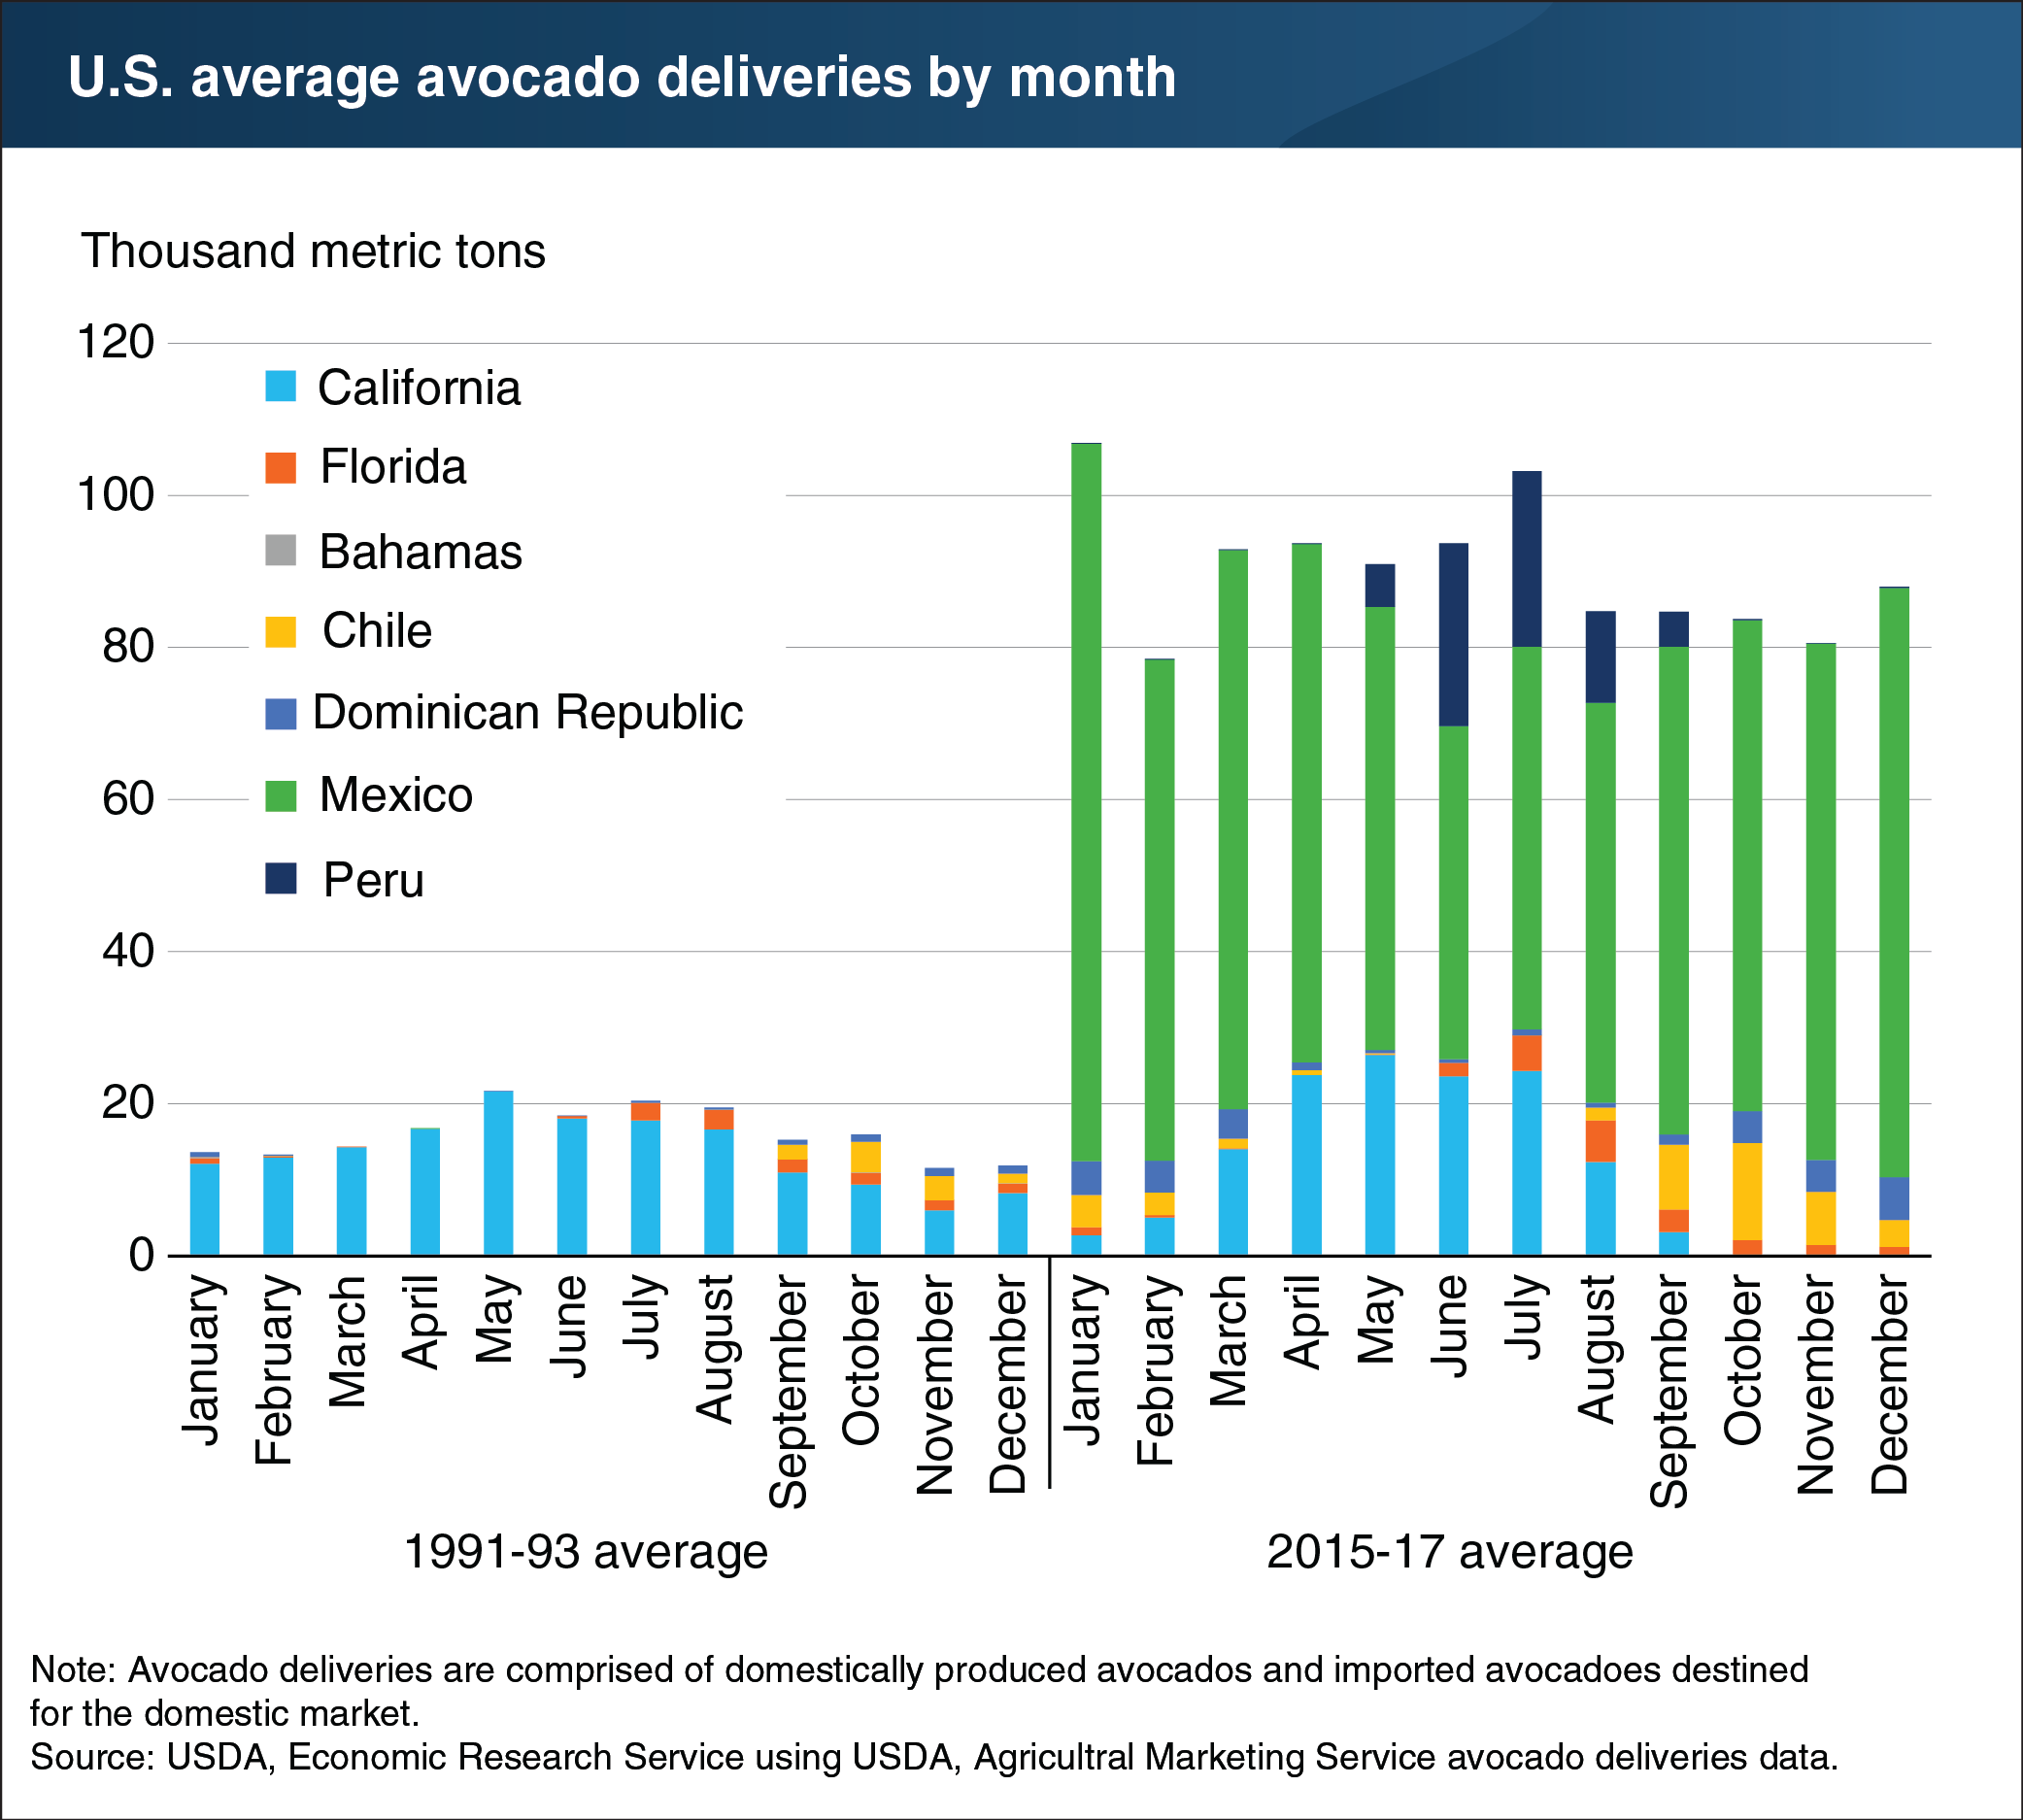
Development of Mexico’s avocado export sector prompted many changes in the U.S. market. USDA initially banned imports of Mexican avocados from 1914 to 1993 to prevent entry of avocado seed weevils into the United States. With the implementation of a USDA phytosanitary work plan from 1993 to 2007 that allowed Hass avocados from certain municipalities in the Mexican State of Michoacán to enter progressively more U.S. States, deliveries from Mexico increased rapidly, reaching 781,000 metric tons (annual average) during 2015-17. Ready access to Mexican product—along with advertising campaigns for avocados in general and Mexican avocados in particular—led to a sharp increase in U.S. avocado consumption. Between 1991-93 and 2015-17, avocado deliveries (imports and domestic production) increased from 193,000 metric tons to 1.1 million metric tons (annual averages). In response to a dramatic increase in foreign competition, U.S. producers have focused mainly on supplying the domestic market in months when imports from Mexico tend to be lower. A new phytosanitary work plan implemented in 2016 allows fresh avocados to be imported from any Mexican State subject to a systems approach to risk management, consisting of a number of sequential safeguards designed to progressively reduce risk of avocado seed weevils to an insignificant level. This chart is drawn from data discussed in the ERS Fruit and Tree Nuts Outlook newsletter released in March 2018.