

Food prices less volatile than transportation prices
- by Annemarie Kuhns
- 7/18/2018
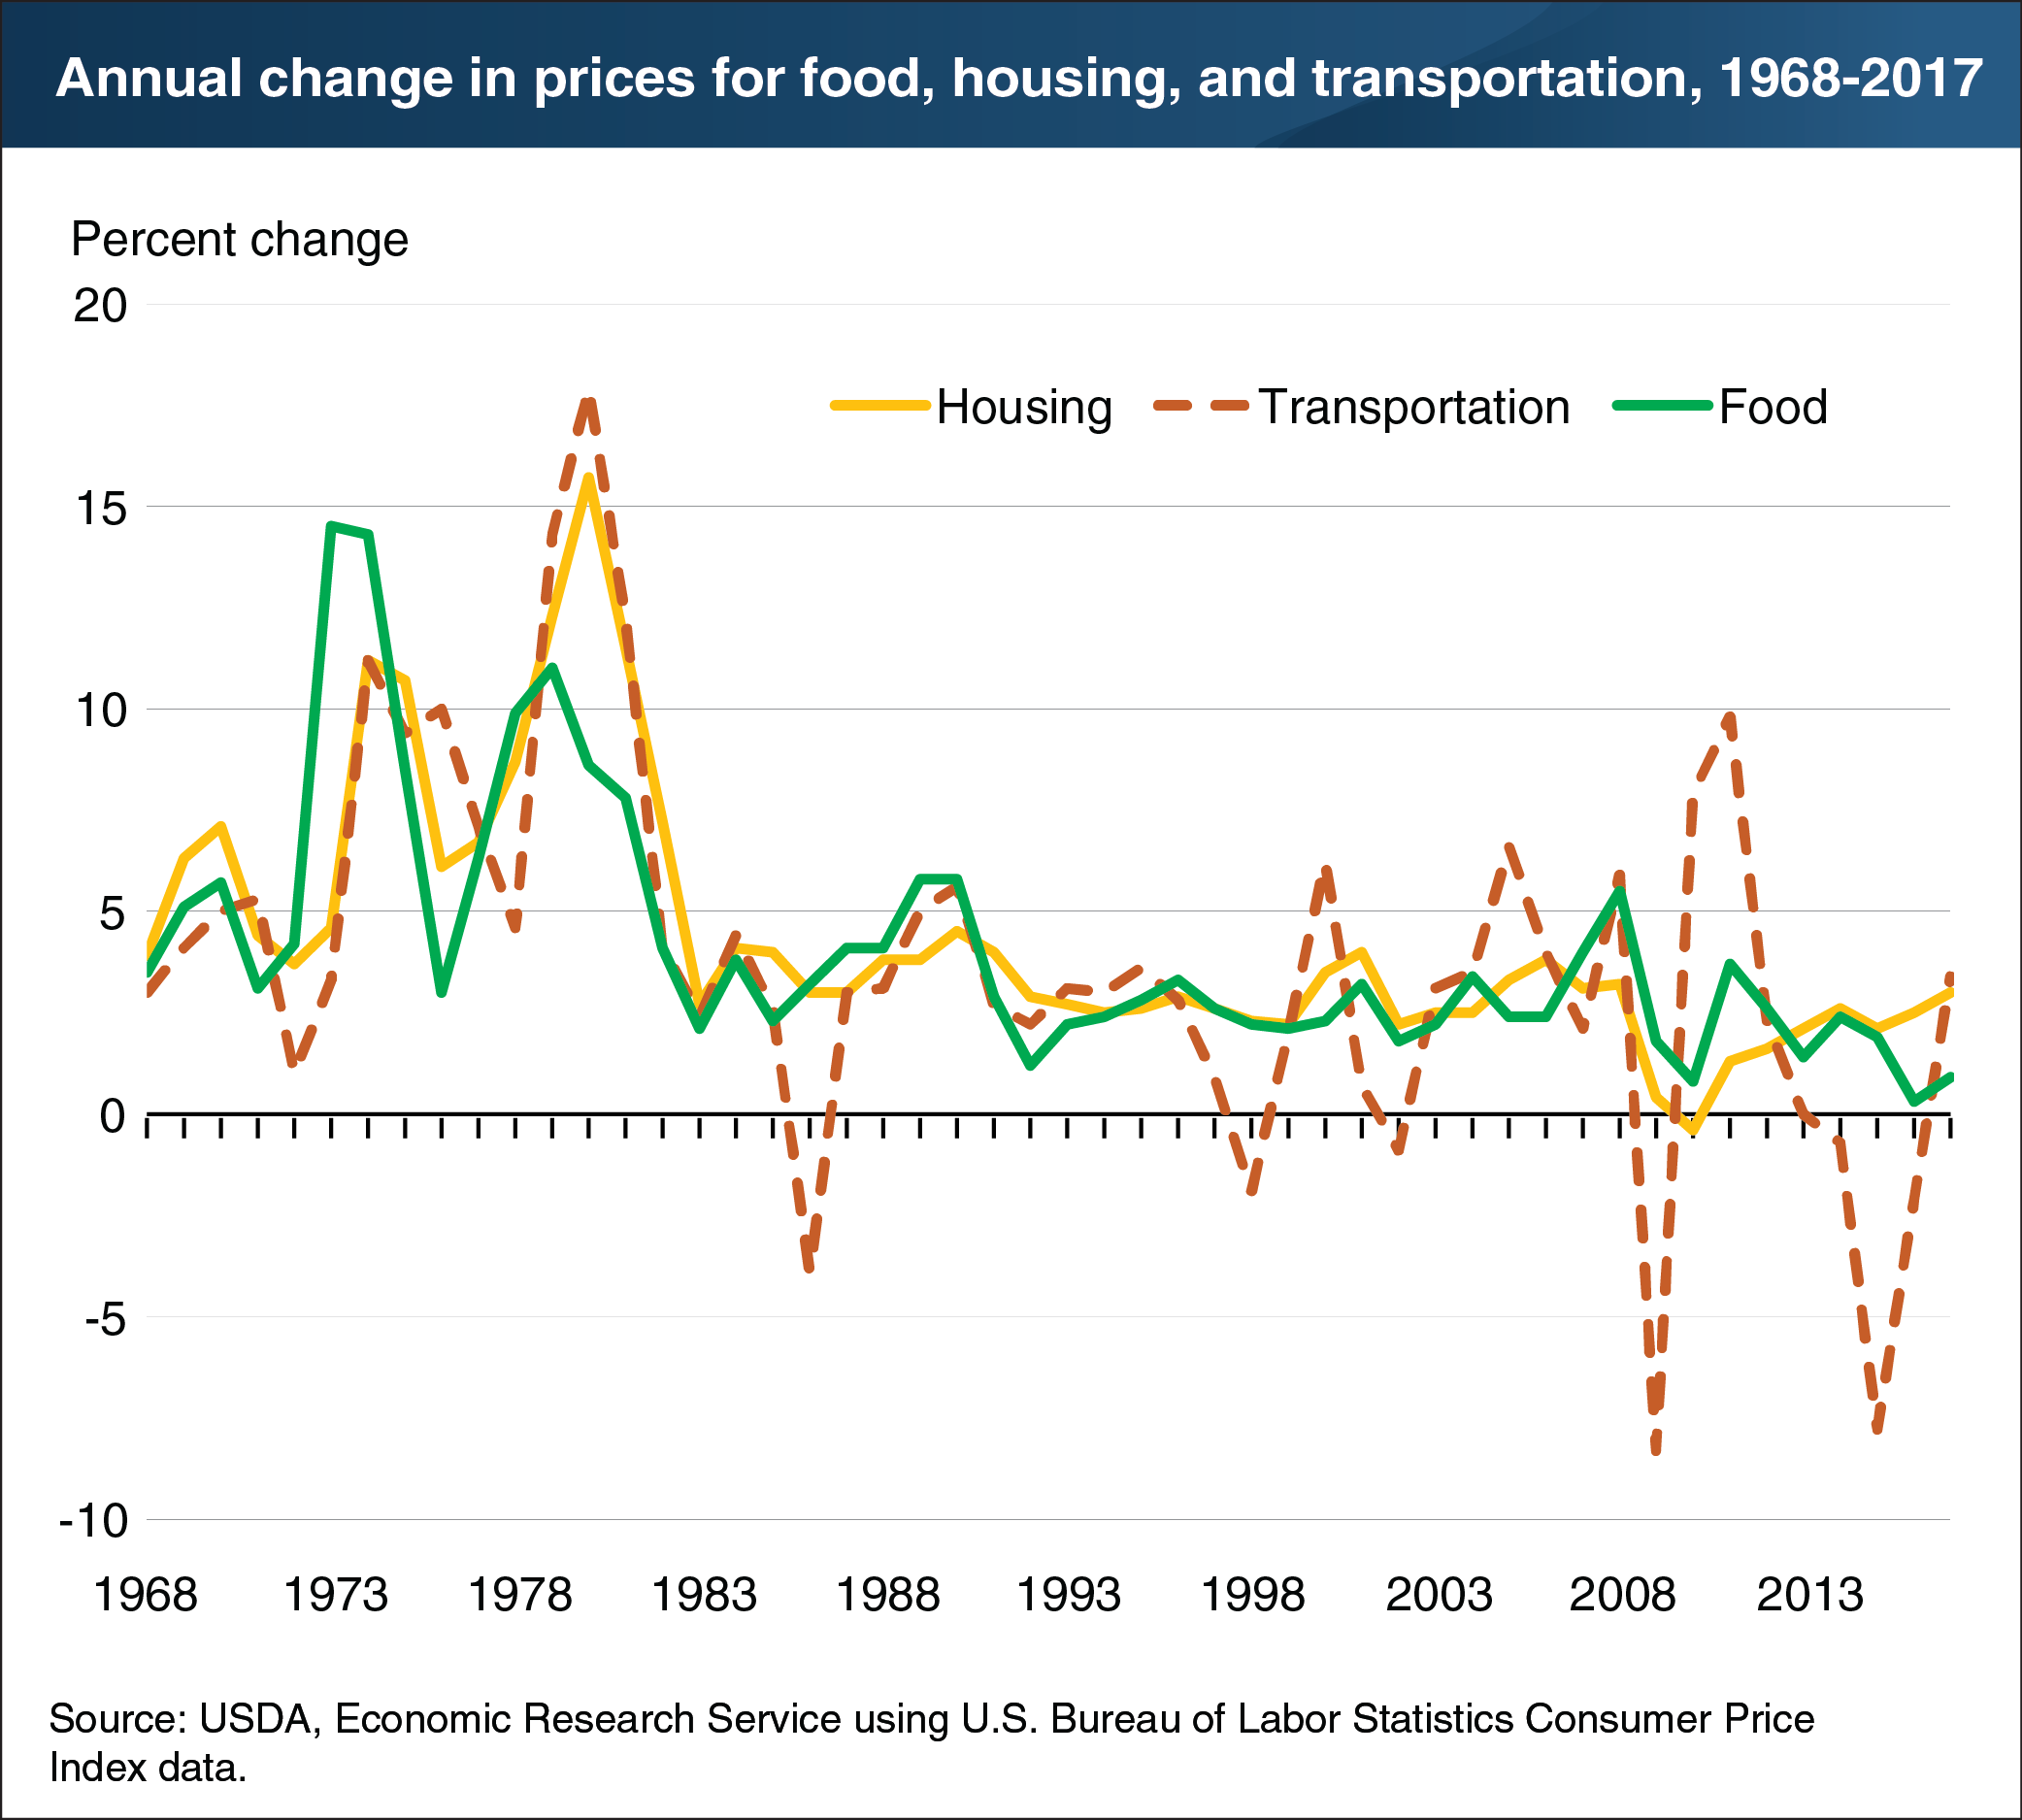
The 1970s were a decade of volatile prices for consumers’ top three spending categories—housing, transportation, and food. Annual food price inflation during the 1970s averaged 8.1 percent, and food prices rose by 10 percent or more in 3 of the 10 years. Yearly price changes for housing costs, which include rents, utilities, and household furnishings, averaged 7.6 percent during the decade and peaked at 15.7 percent in 1980. And price changes for transportation (prices of vehicles, gasoline and diesel fuel, and public transportation) topped 10 percent in 1974, 1976, and 1979 and jumped 17.9 percent in 1980. Since that time, prices for food and housing have become comparatively more stable than transportation prices, which continue to be volatile from year to year. Food prices in 2016 and 2017 changed little as decreasing prices for food commodities and energy offset rising costs for other food processing, marketing, and food service inputs. At the same time, a strong U.S. dollar lowered the cost of imported foods. This chart appears in “Five Decades of Price Swings for Food and Other Consumer Spending Categories” in the July 2018 issue of ERS’s Amber Waves magazine.