

Net cash farm income forecast to fall below 1970-2016 average level
- by Nigel Key
- 7/3/2018
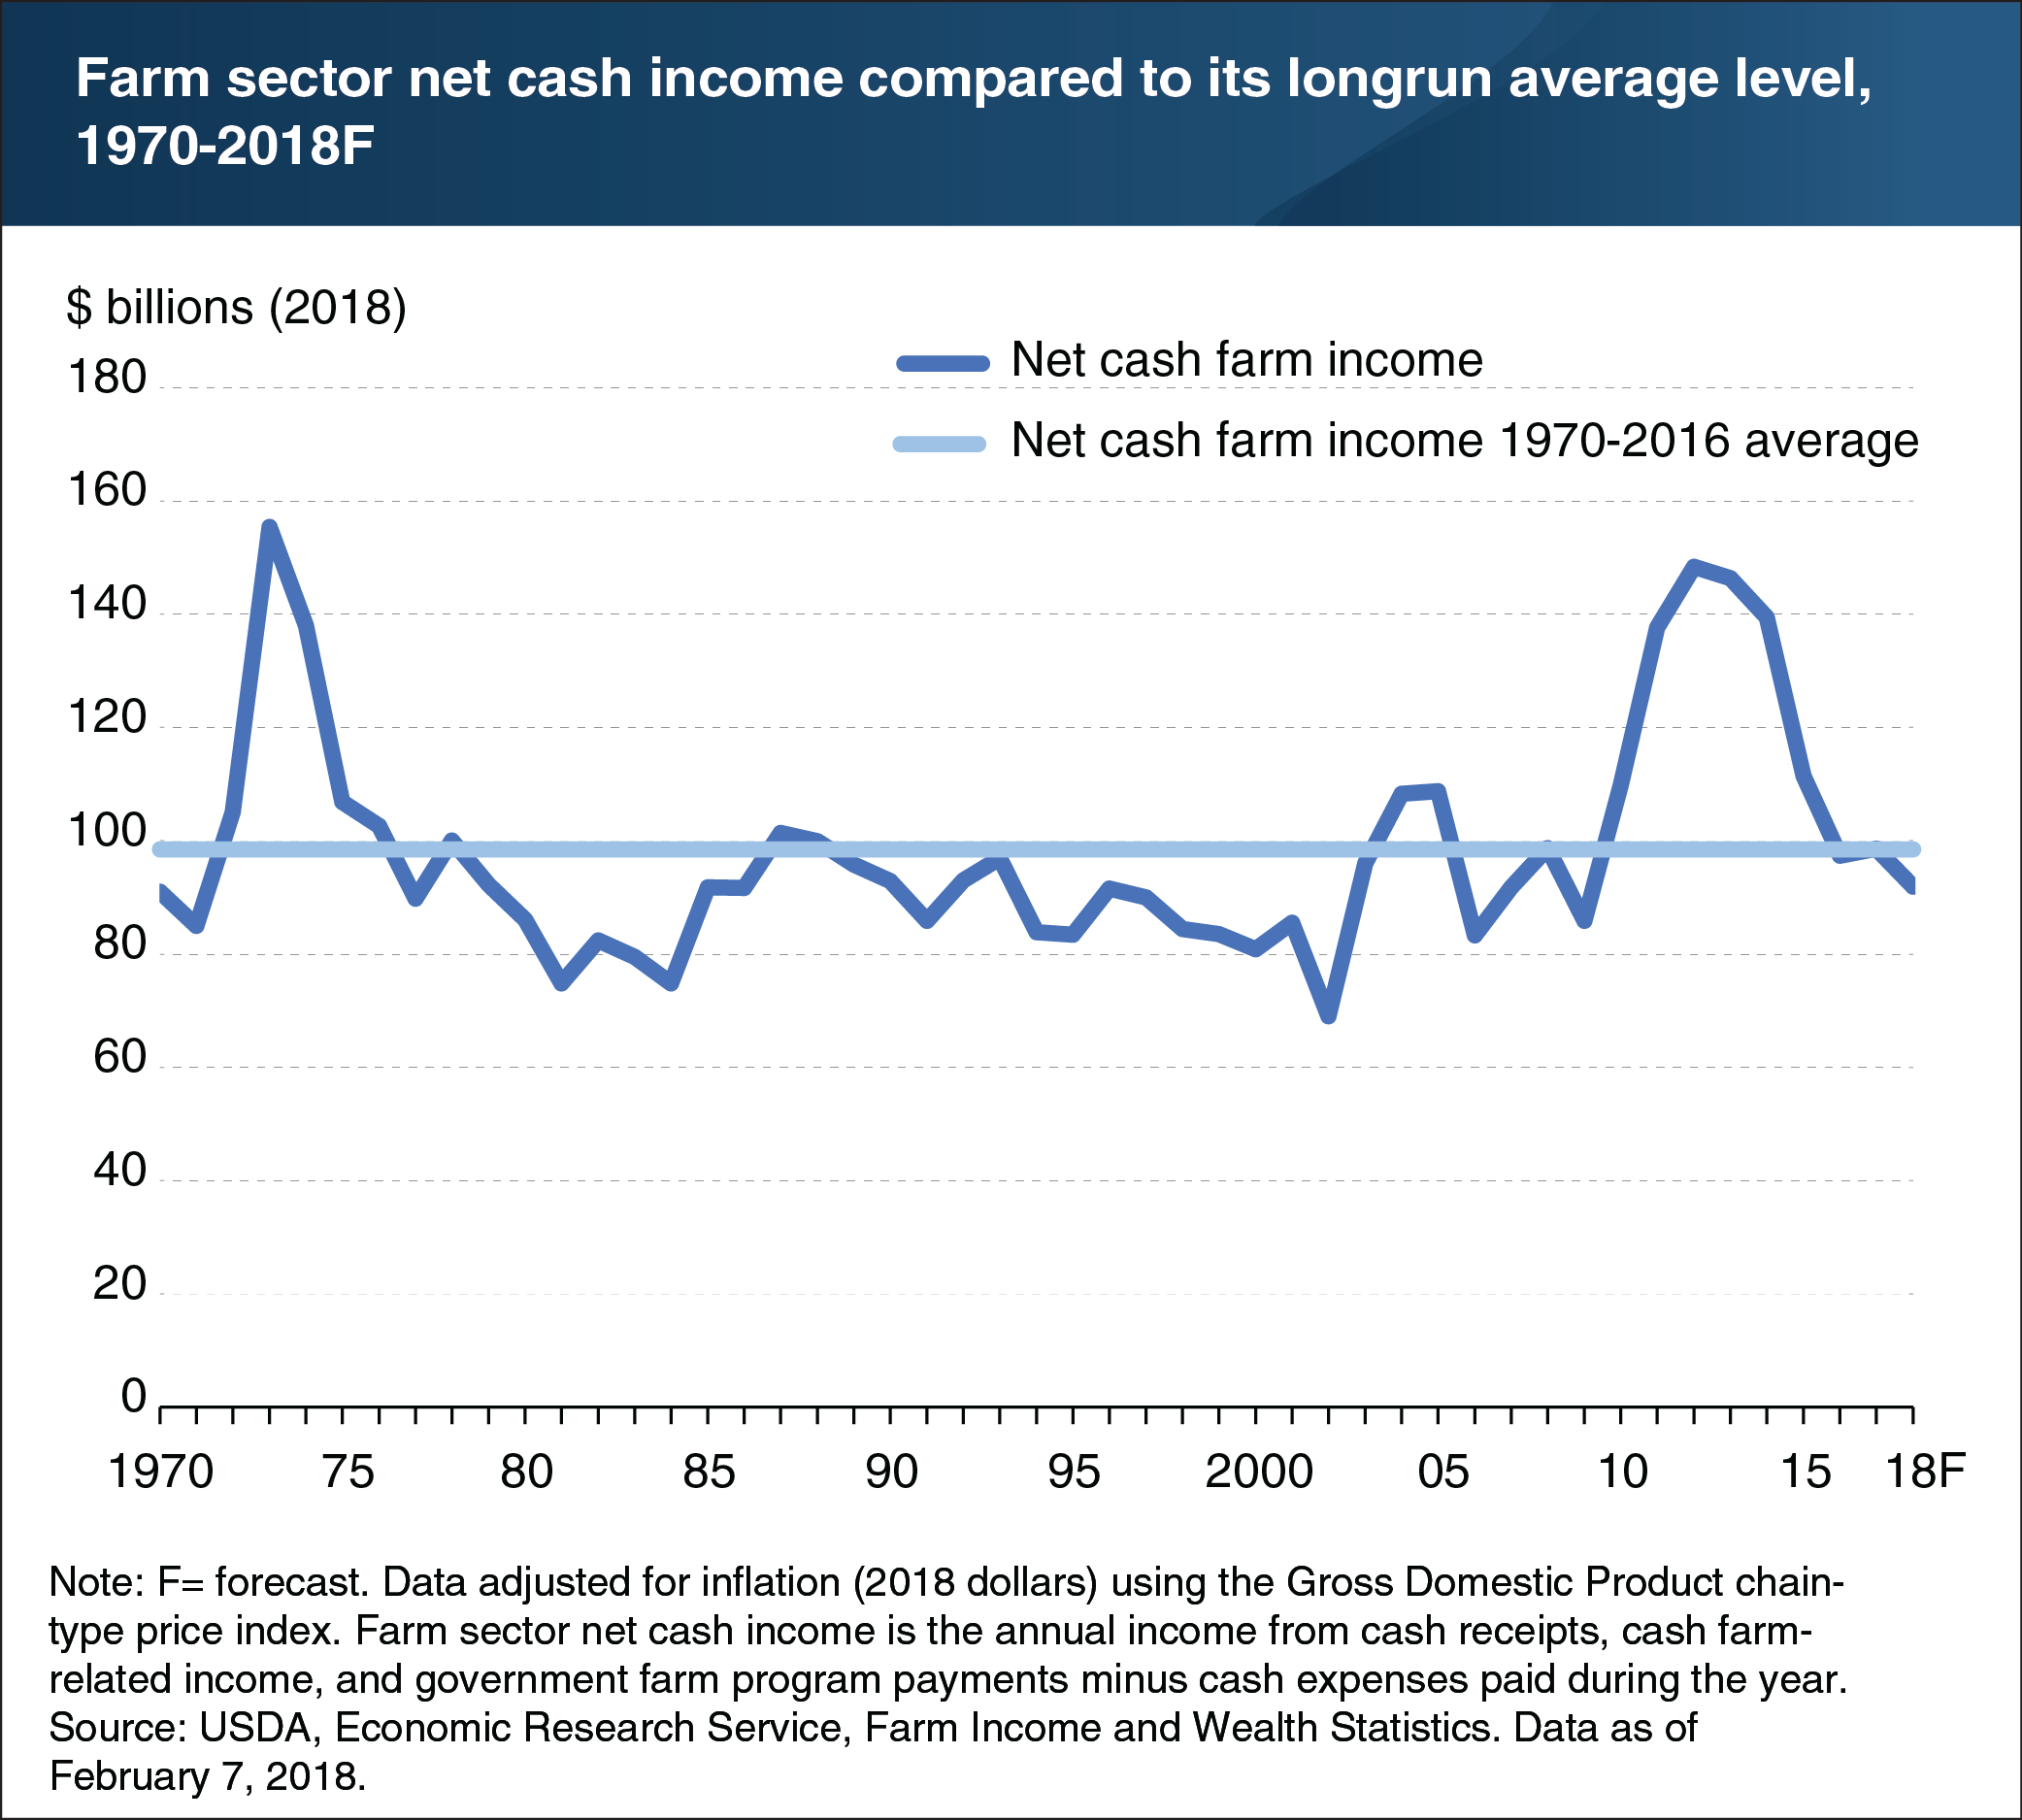
Farm sector net cash farm income is a measure of the profitability of farming and, hence, the ability of farmers to meet their loan obligations, invest in new machinery, remain in production, expand their operations, and provide for family living expenses. Beginning in 2010, inflation-adjusted farm sector net cash income rose to near record highs, peaking in 2012. Much of this growth was due to commodity cash receipts, which increased by $113.2 billion from 2009 to 2014. Between 2012 and 2016, however, farm sector net cash income fell 33 percent to $97.3 billion. This is the largest multiyear decline since the 1970s in both absolute and percentage terms. Slowing global demand, a strengthening dollar, and large inventories depressed crop as well as animal and animal product prices and contributed to the decline. Although the decline is large, when viewed over a longer time horizon, net cash farm income has returned near levels seen before the record growth from 2010 to 2013. ERS forecasts net cash farm income in 2018 to be 7 percent below the average across 1970-2016. This chart appears in the July 2018 Amber Waves feature, “Current Indicators of Farm Sector Financial Health.”