

Hourly wages for hired farmworkers have grown steadily since 1989
- by Thomas Hertz
- 6/20/2018
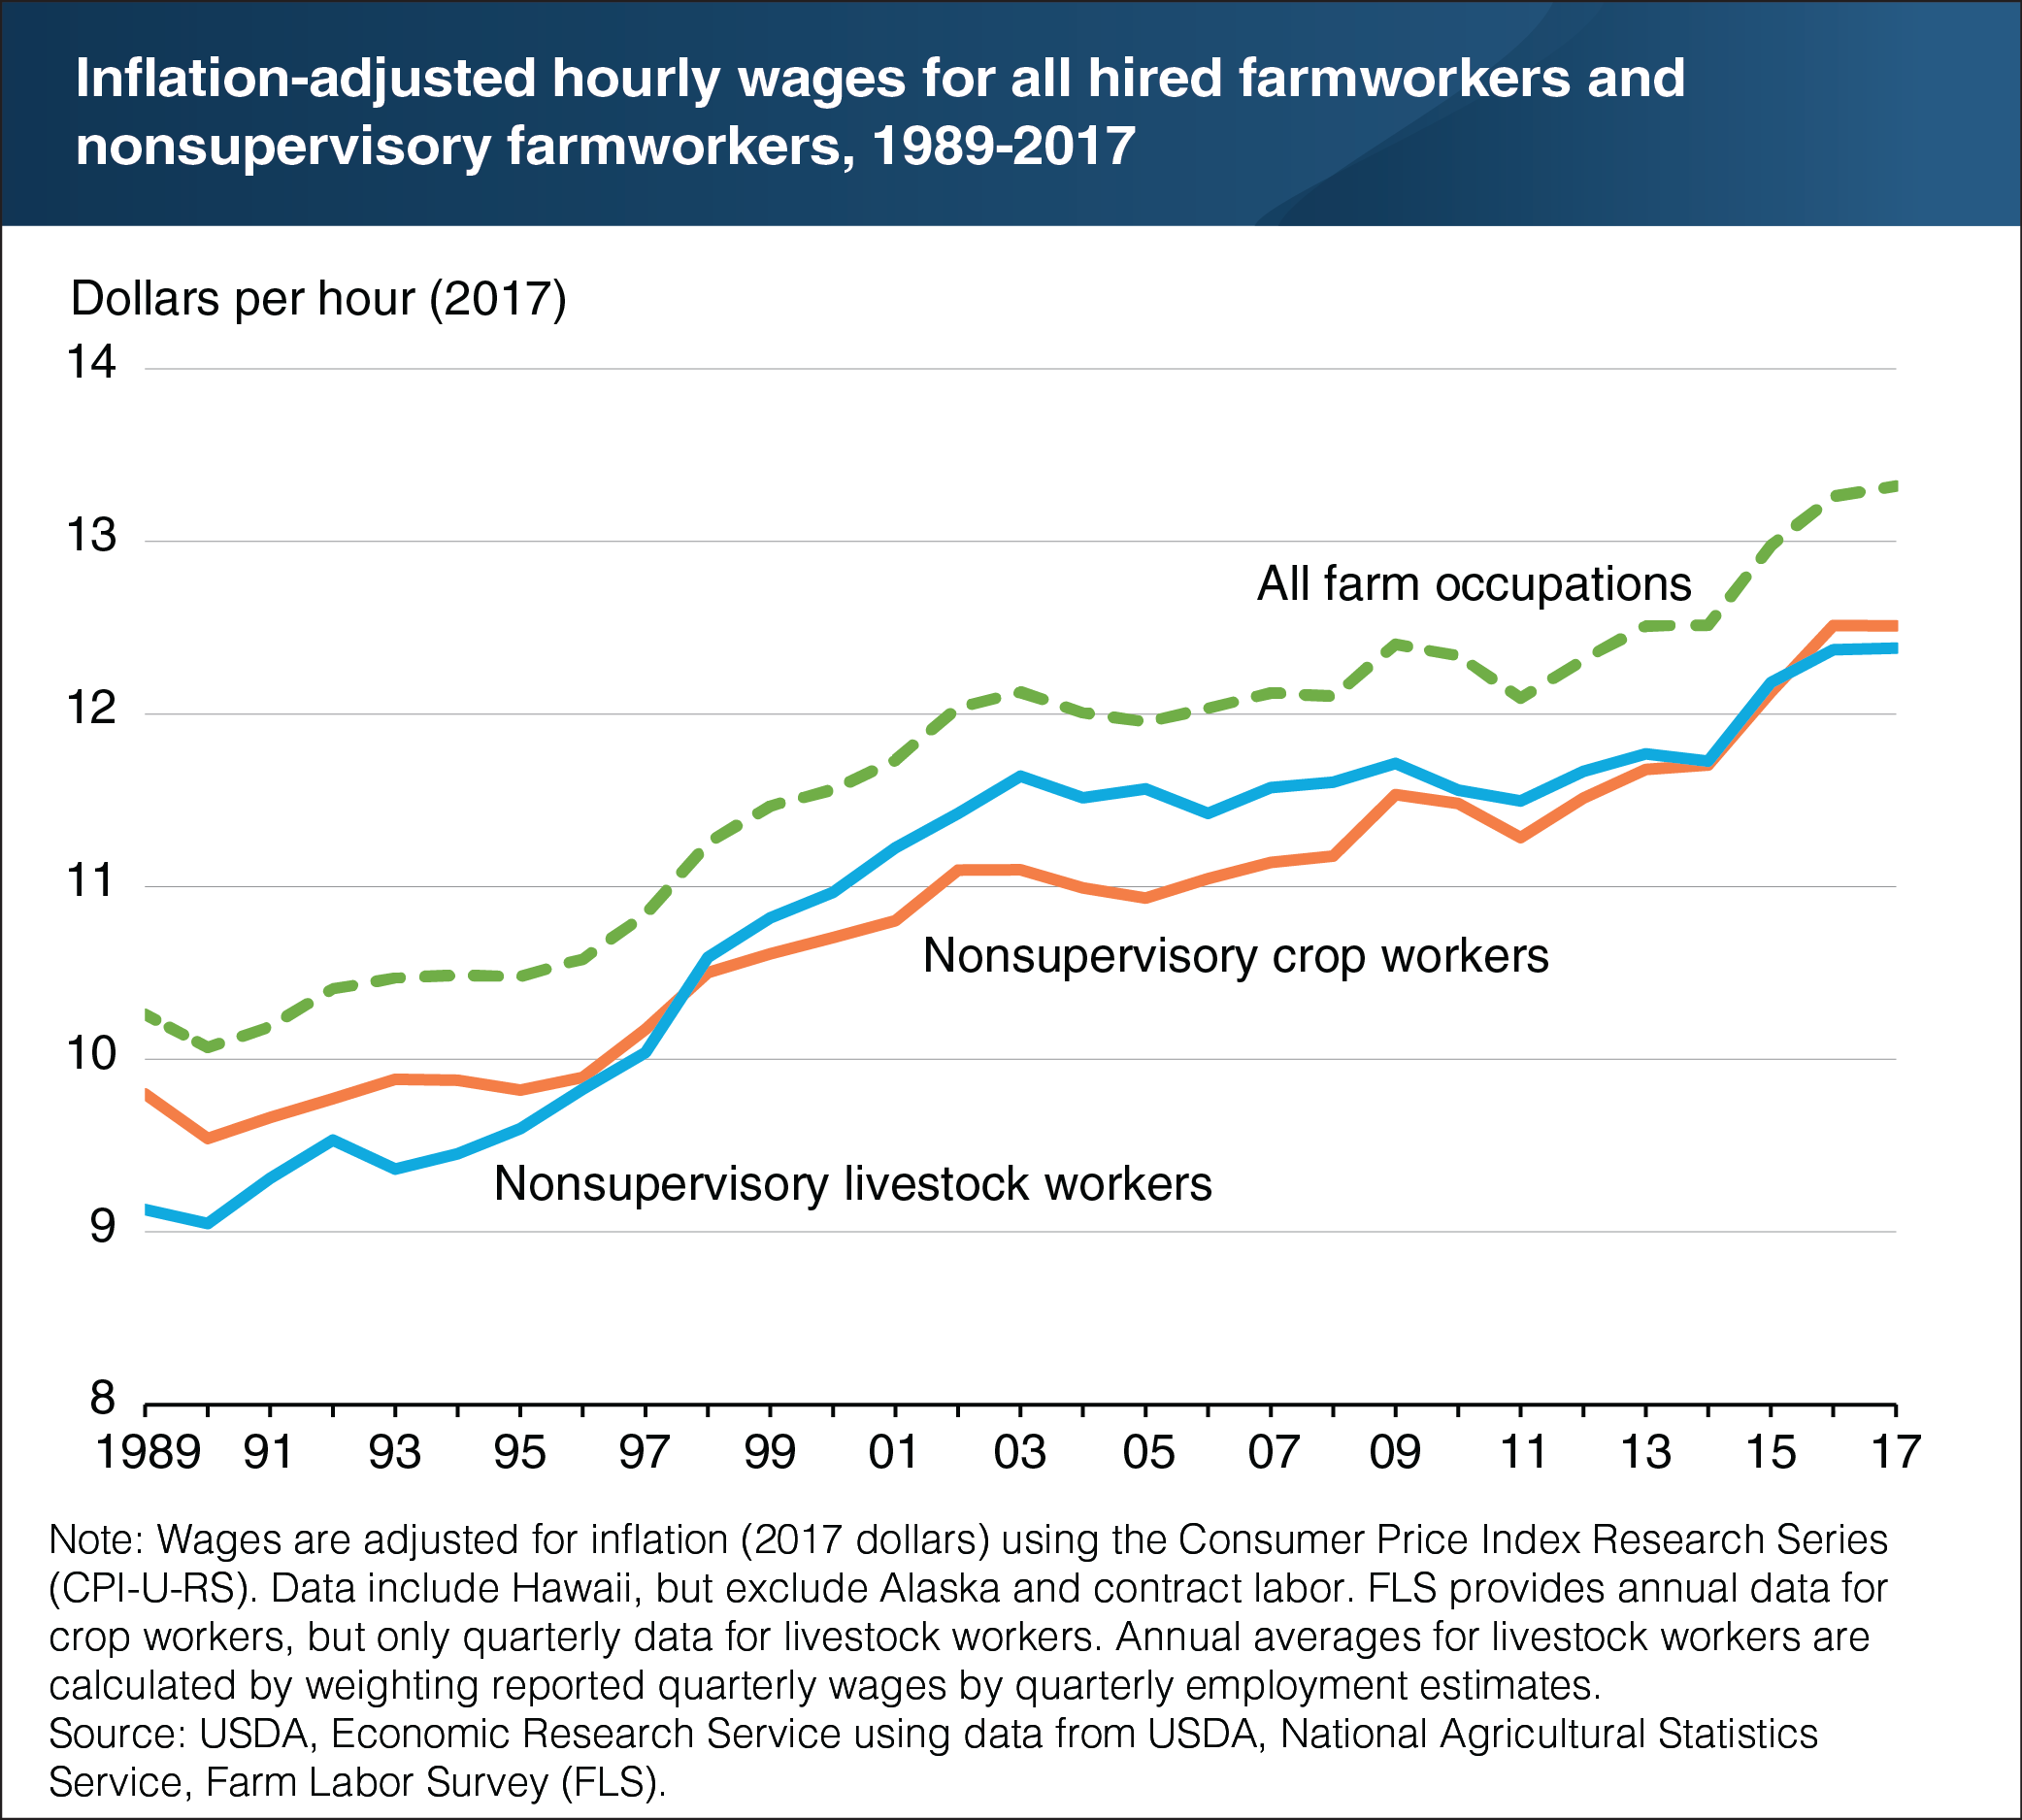
Hired farmworkers are found in a variety of occupations, including field crop workers, nursery workers, livestock workers, graders and sorters, agricultural inspectors, supervisors, and hired farm managers. Since 1989, the average hourly wage for hired farmworkers (excluding contract labor) has increased at almost 1 percent per year, after adjusting for inflation—reaching an annual average of $13.32 per hour in 2017. Wages grew by 3.7 percent in 2015 and 2.2 percent in 2016, but grew only 0.5 percent in 2017. Wage growth for nonsupervisory farmworkers was lower than the average for all hired farmworkers. In 2017, nonsupervisory farmworkers averaged $12.47 per hour, with little difference between crop and livestock wage rates. Higher demand for farm labor and a lower supply of immigrant labor since 2007 have contributed to rising wages. This chart appears in the ERS topic page for Farm Labor, updated May 2018.