
SNAP households acquire about as many calories as other households but spend less
- by Joanne Guthrie and Lisa Mancino
- 3/27/2018
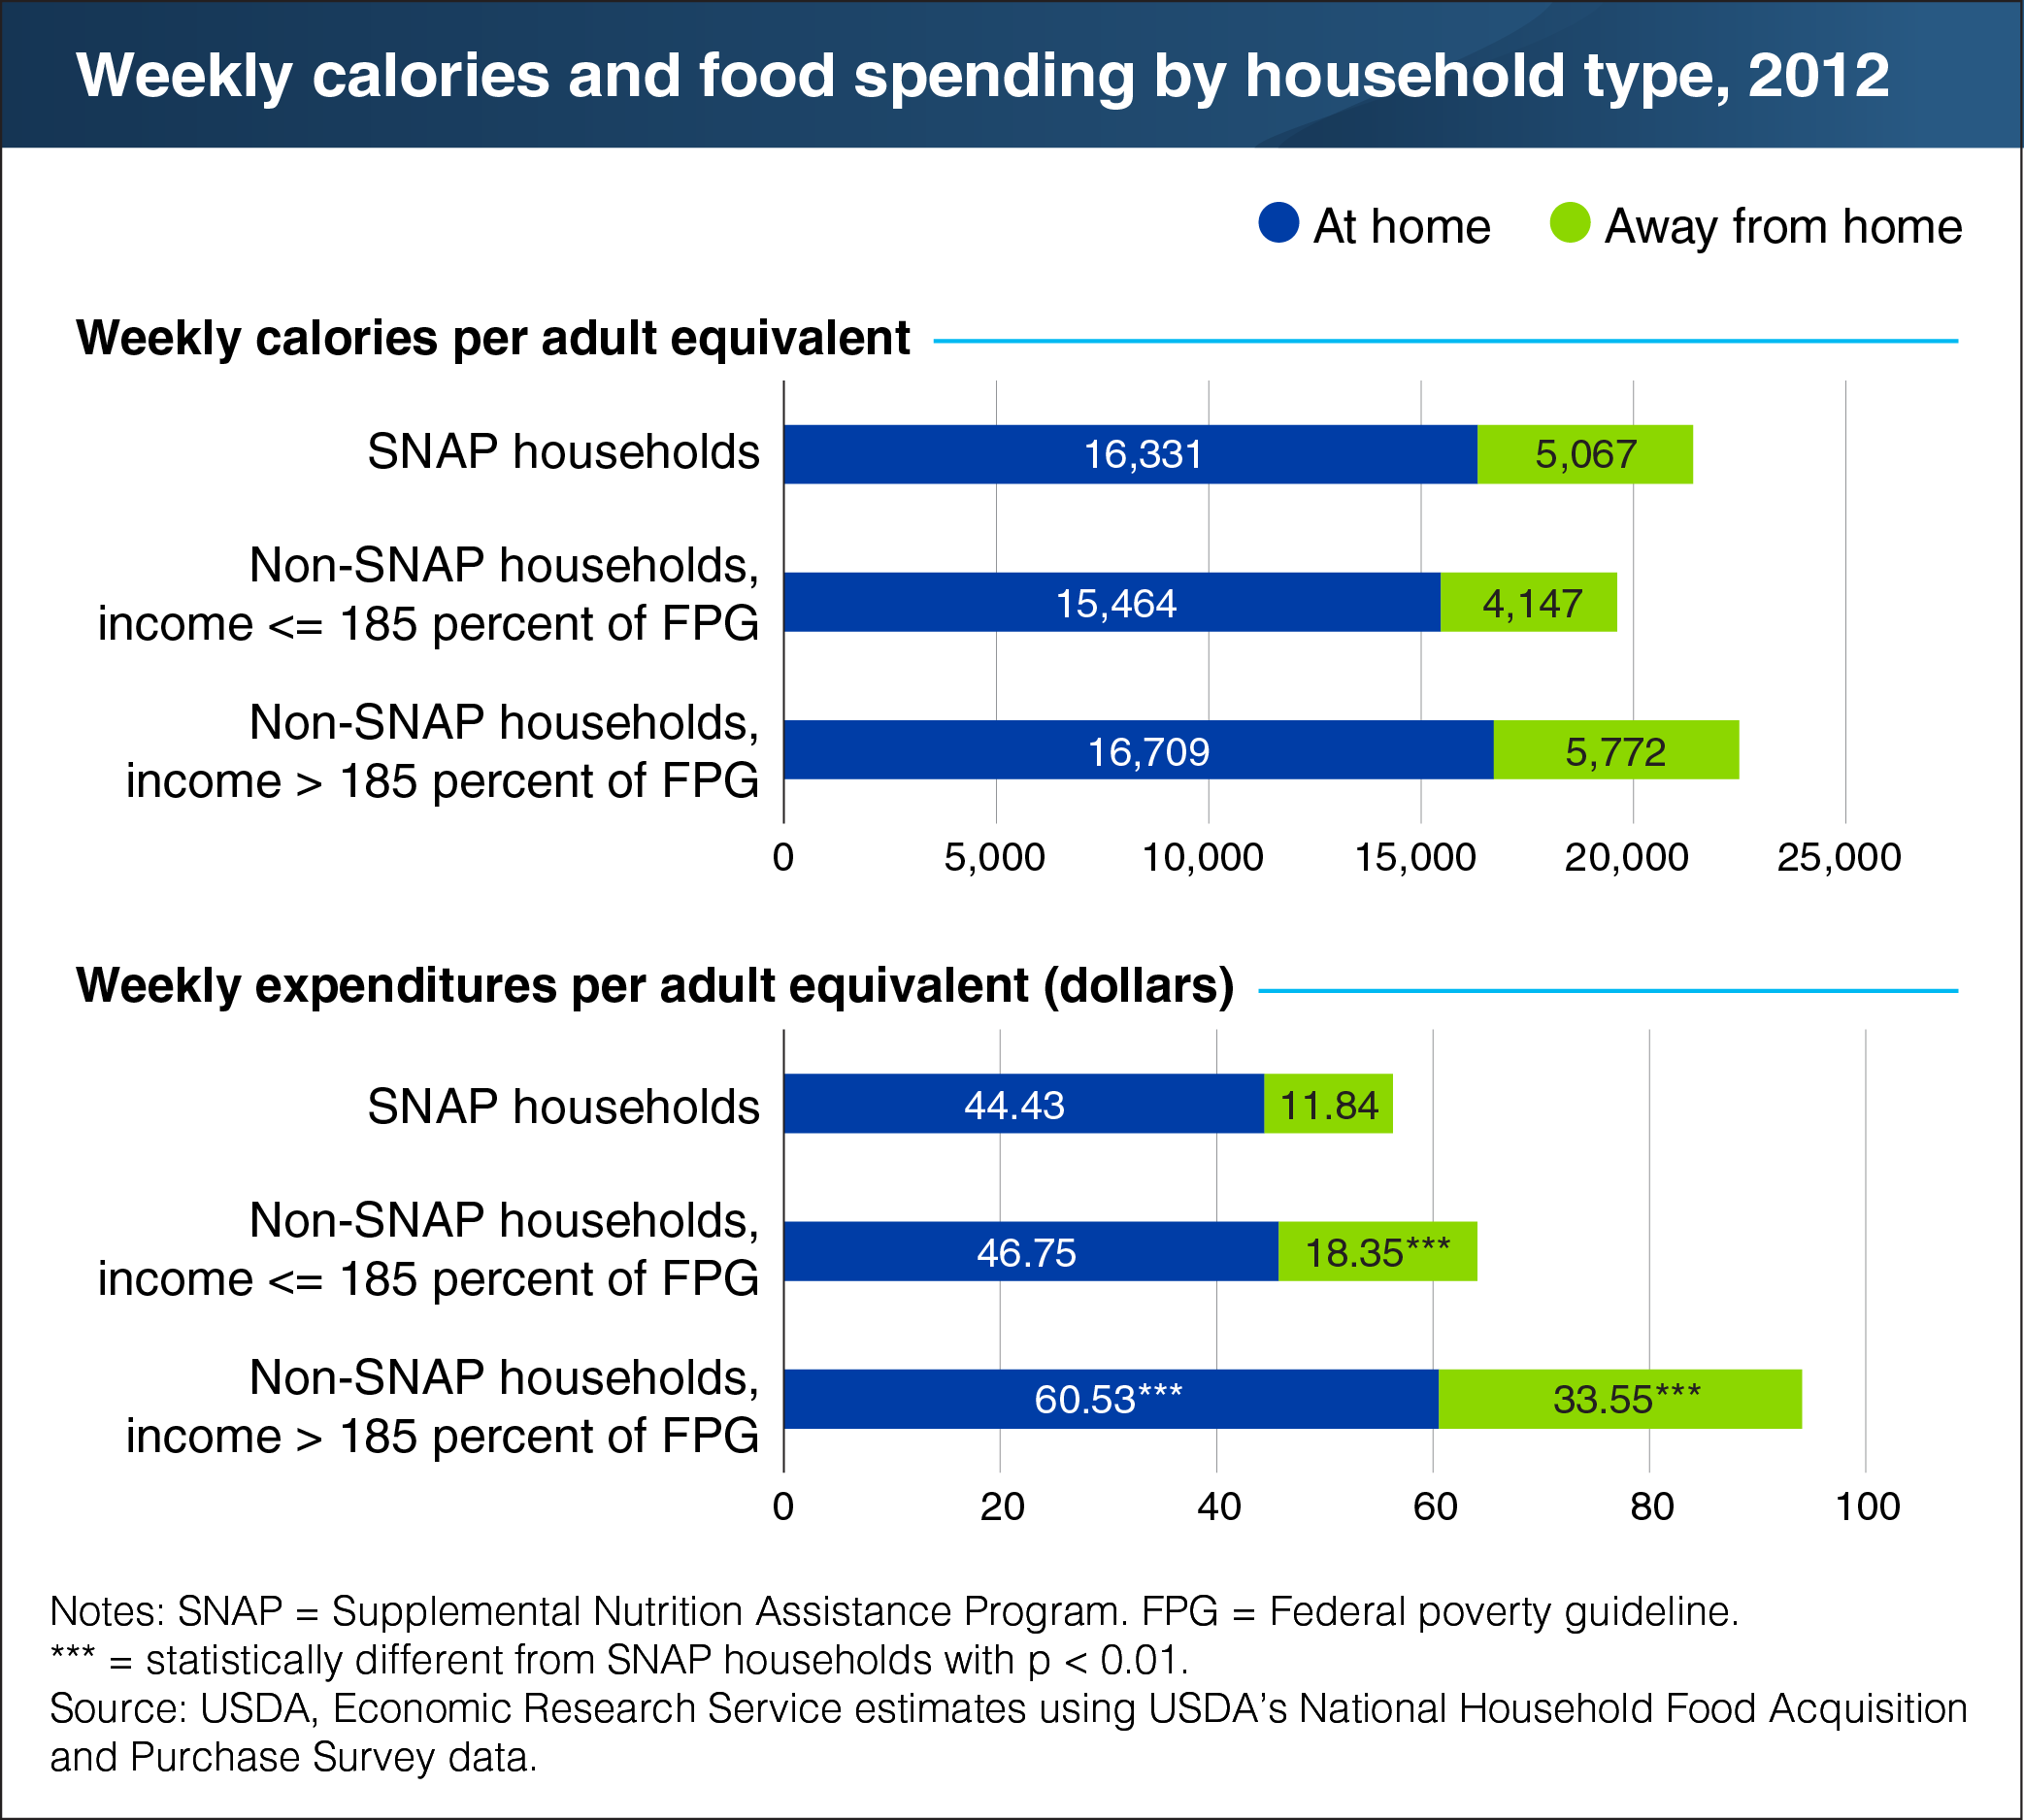
Households may have similar food needs but different budgets with which to meet them. ERS researchers used data from USDA’s National Household Food Acquisition and Purchase Survey (FoodAPS) to estimate the number of calories acquired (purchased or obtained for free) and the money spent to get them for three groups: households participating in USDA’s Supplemental Nutrition Assistance Program (SNAP), low-income non-SNAP households, and higher income non-SNAP households. Researchers adjusted for the age, gender, and number of household members using an adult equivalent measure. Average acquired calories per adult equivalent were similar for all three groups, but food expenditures were not. Expenditure estimates from FoodAPS data show that SNAP households spent roughly $37 less per adult equivalent per week on food than higher income non-SNAP households. SNAP households devoted less of their food dollars to purchases from restaurants and other away-from-home sources, and instead relied more on school meals and family and friends. For at-home foods, SNAP households may have visited lower priced stores or bought a different mix of foods to stretch their food budgets. This chart appears in the February 2018 Amber Waves article, "Supermarkets, Schools, and Social Gatherings: Where Supplemental Nutrition Assistance Program and Other U.S. Households Acquire Their Foods Correlates with Nutritional Quality."
We’d welcome your feedback!
Would you be willing to answer a few quick questions about your experience?