

Rural households account for nearly one-fifth of U.S. food-insecure households
- by Matthew P. Rabbitt, Alisha Coleman-Jensen and Christian A. Gregory
- 12/14/2017
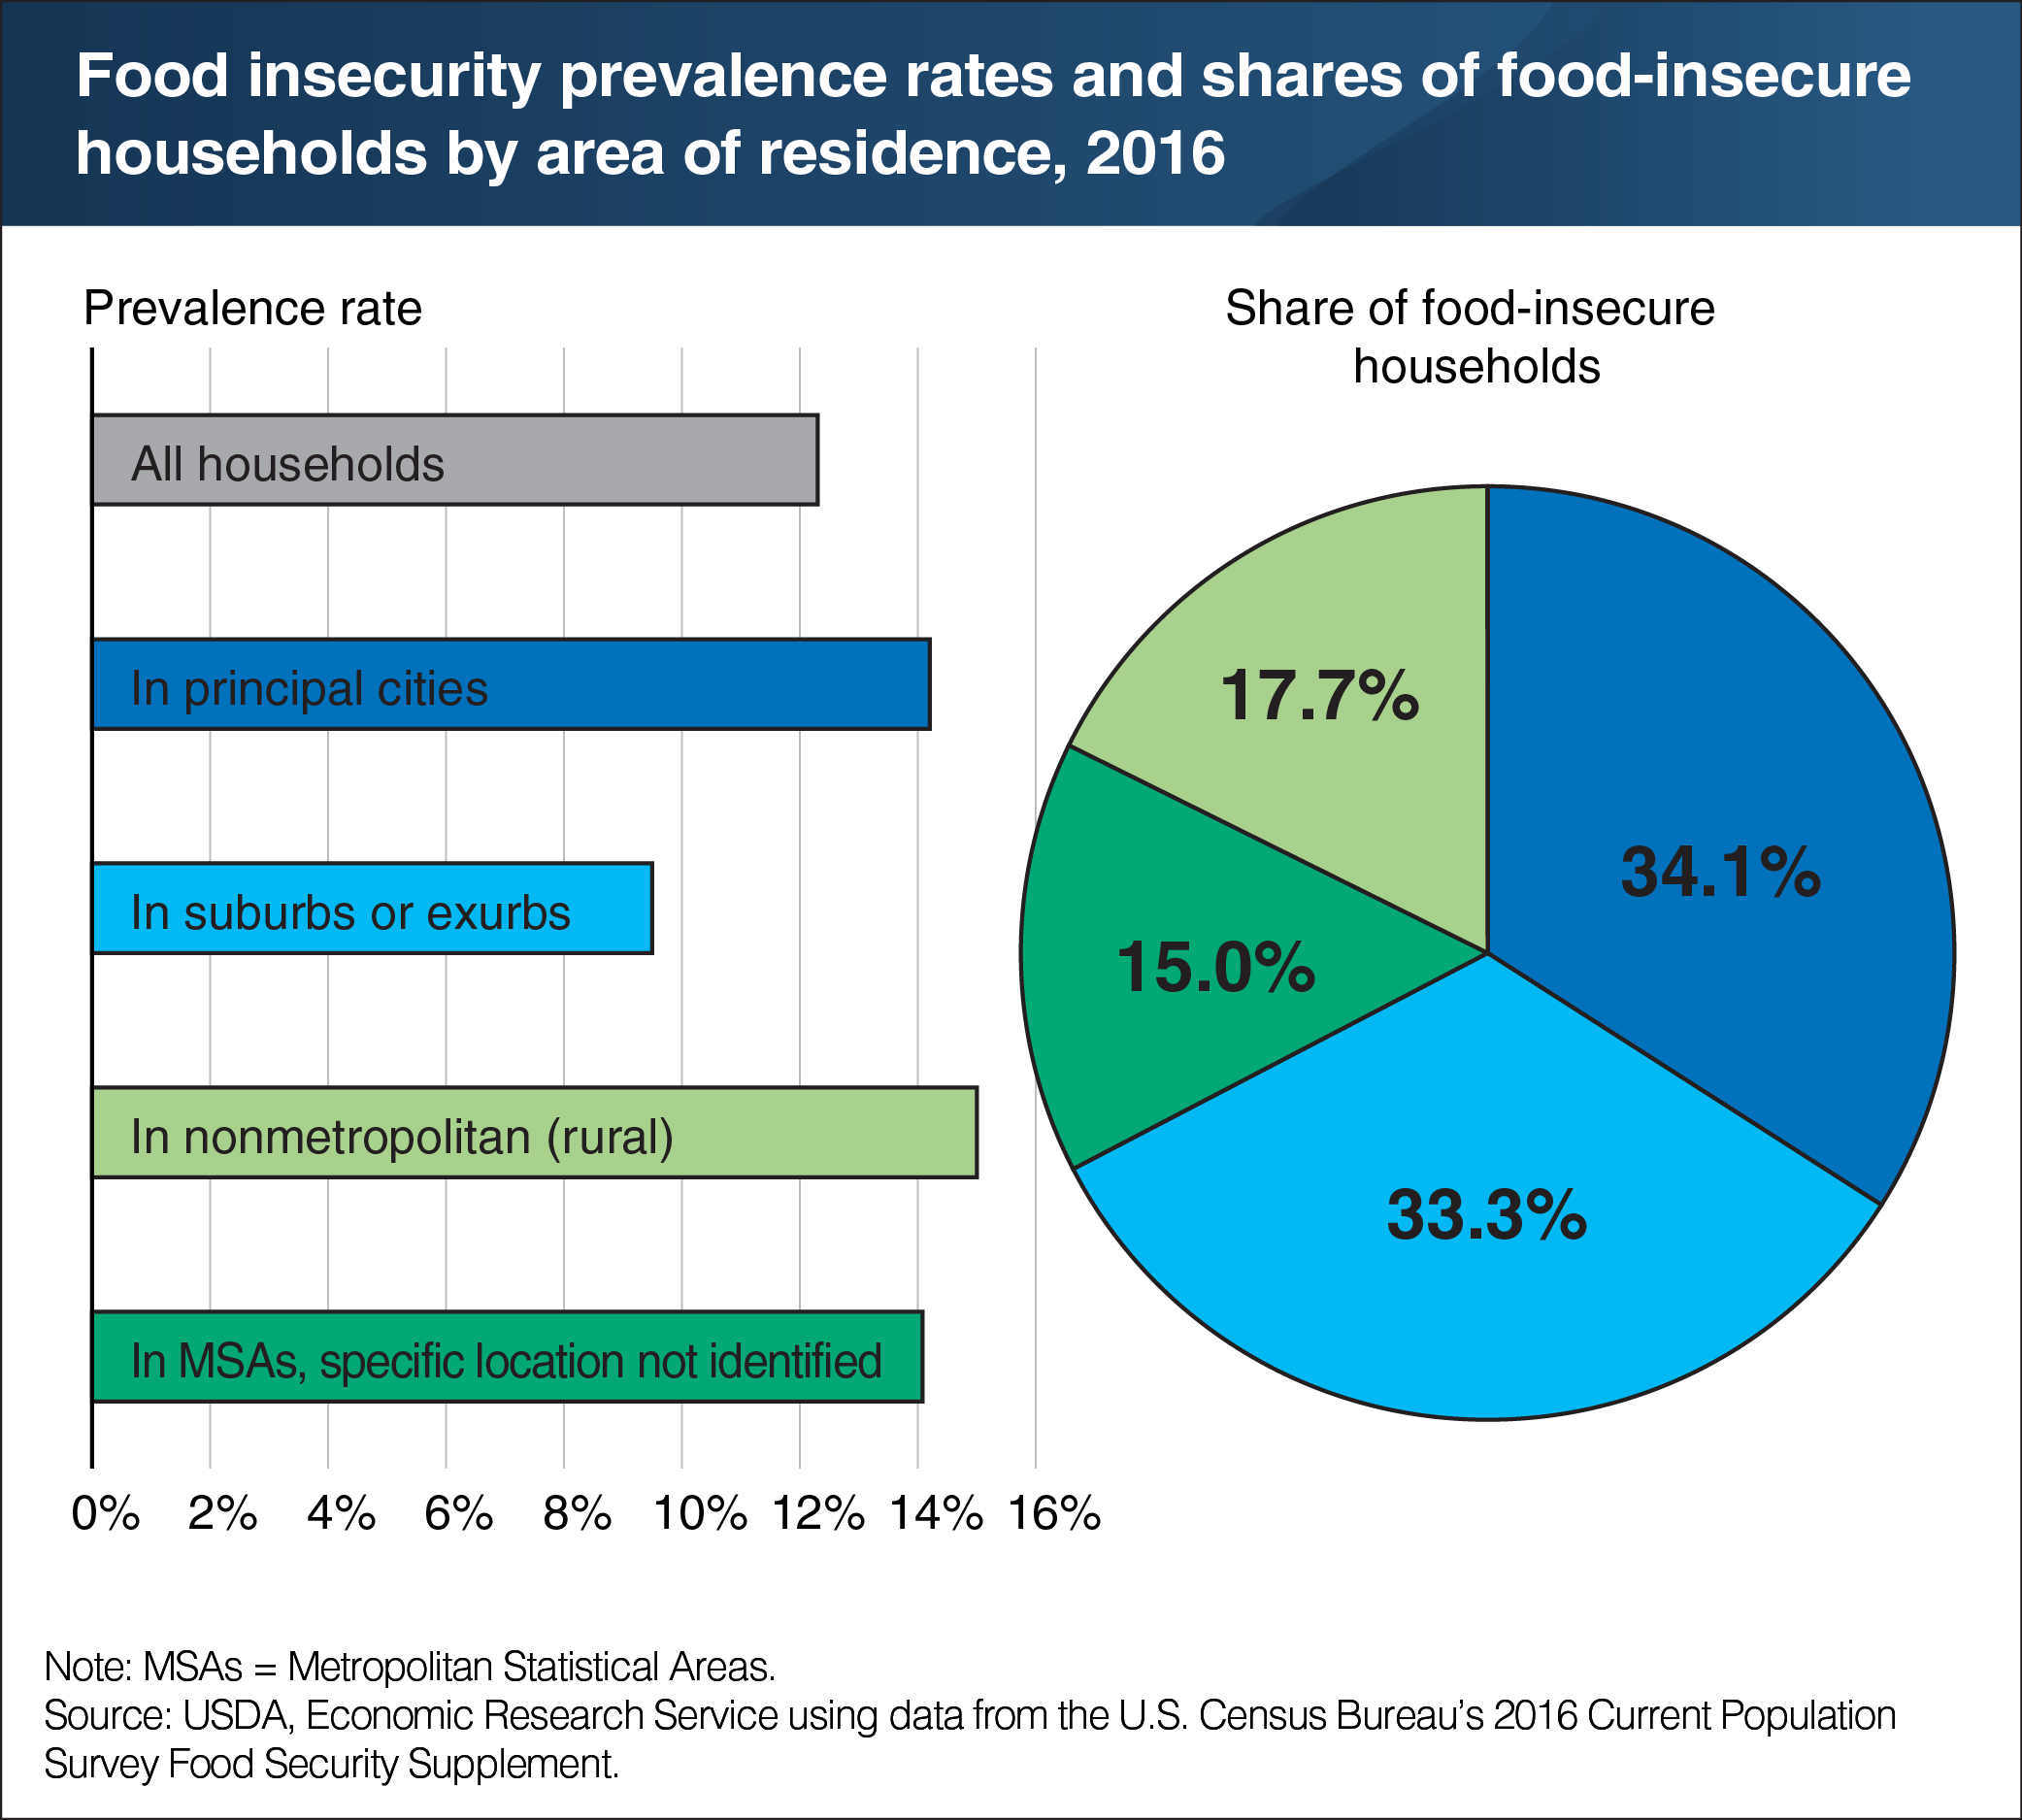
Some U.S. demographic groups are more likely than others to be food insecure—meaning they struggled at some time during the year to provide enough food for all their members. Understanding which groups are at increased risk of food insecurity is helpful for targeting assistance to those most in need, as is understanding the frequency of a group’s occurrence in the food-insecure population. A group could have a relatively low risk of food insecurity, but be so large that the members of the group who are experiencing food insecurity make up a large share of all food-insecure households. For example, while the prevalence of food insecurity in 2016 was relatively low for households in suburbs or exurbs of principal cities (9.5 percent), this group accounted for one-third of food insecure households. Rural households had a food insecurity rate of 15 percent in 2016 and accounted for 18 percent of food-insecure households—a higher share than their 14-percent share of all U.S. households. A version of this chart appears in "Understanding the Prevalence, Severity, and Distribution of Food Insecurity in the United States" in the September 2017 issue of ERS’s Amber Waves magazine.