

Cropland is shifting to larger farms, even as average size changes little
- by Robert A. Hoppe
- 11/24/2017
Errata: On November 24, 2017, the Chart of Note article “Cropland is shifting to larger farms, even as average size changes little” was reposted to correct a mislabeling in the chart’s legend.
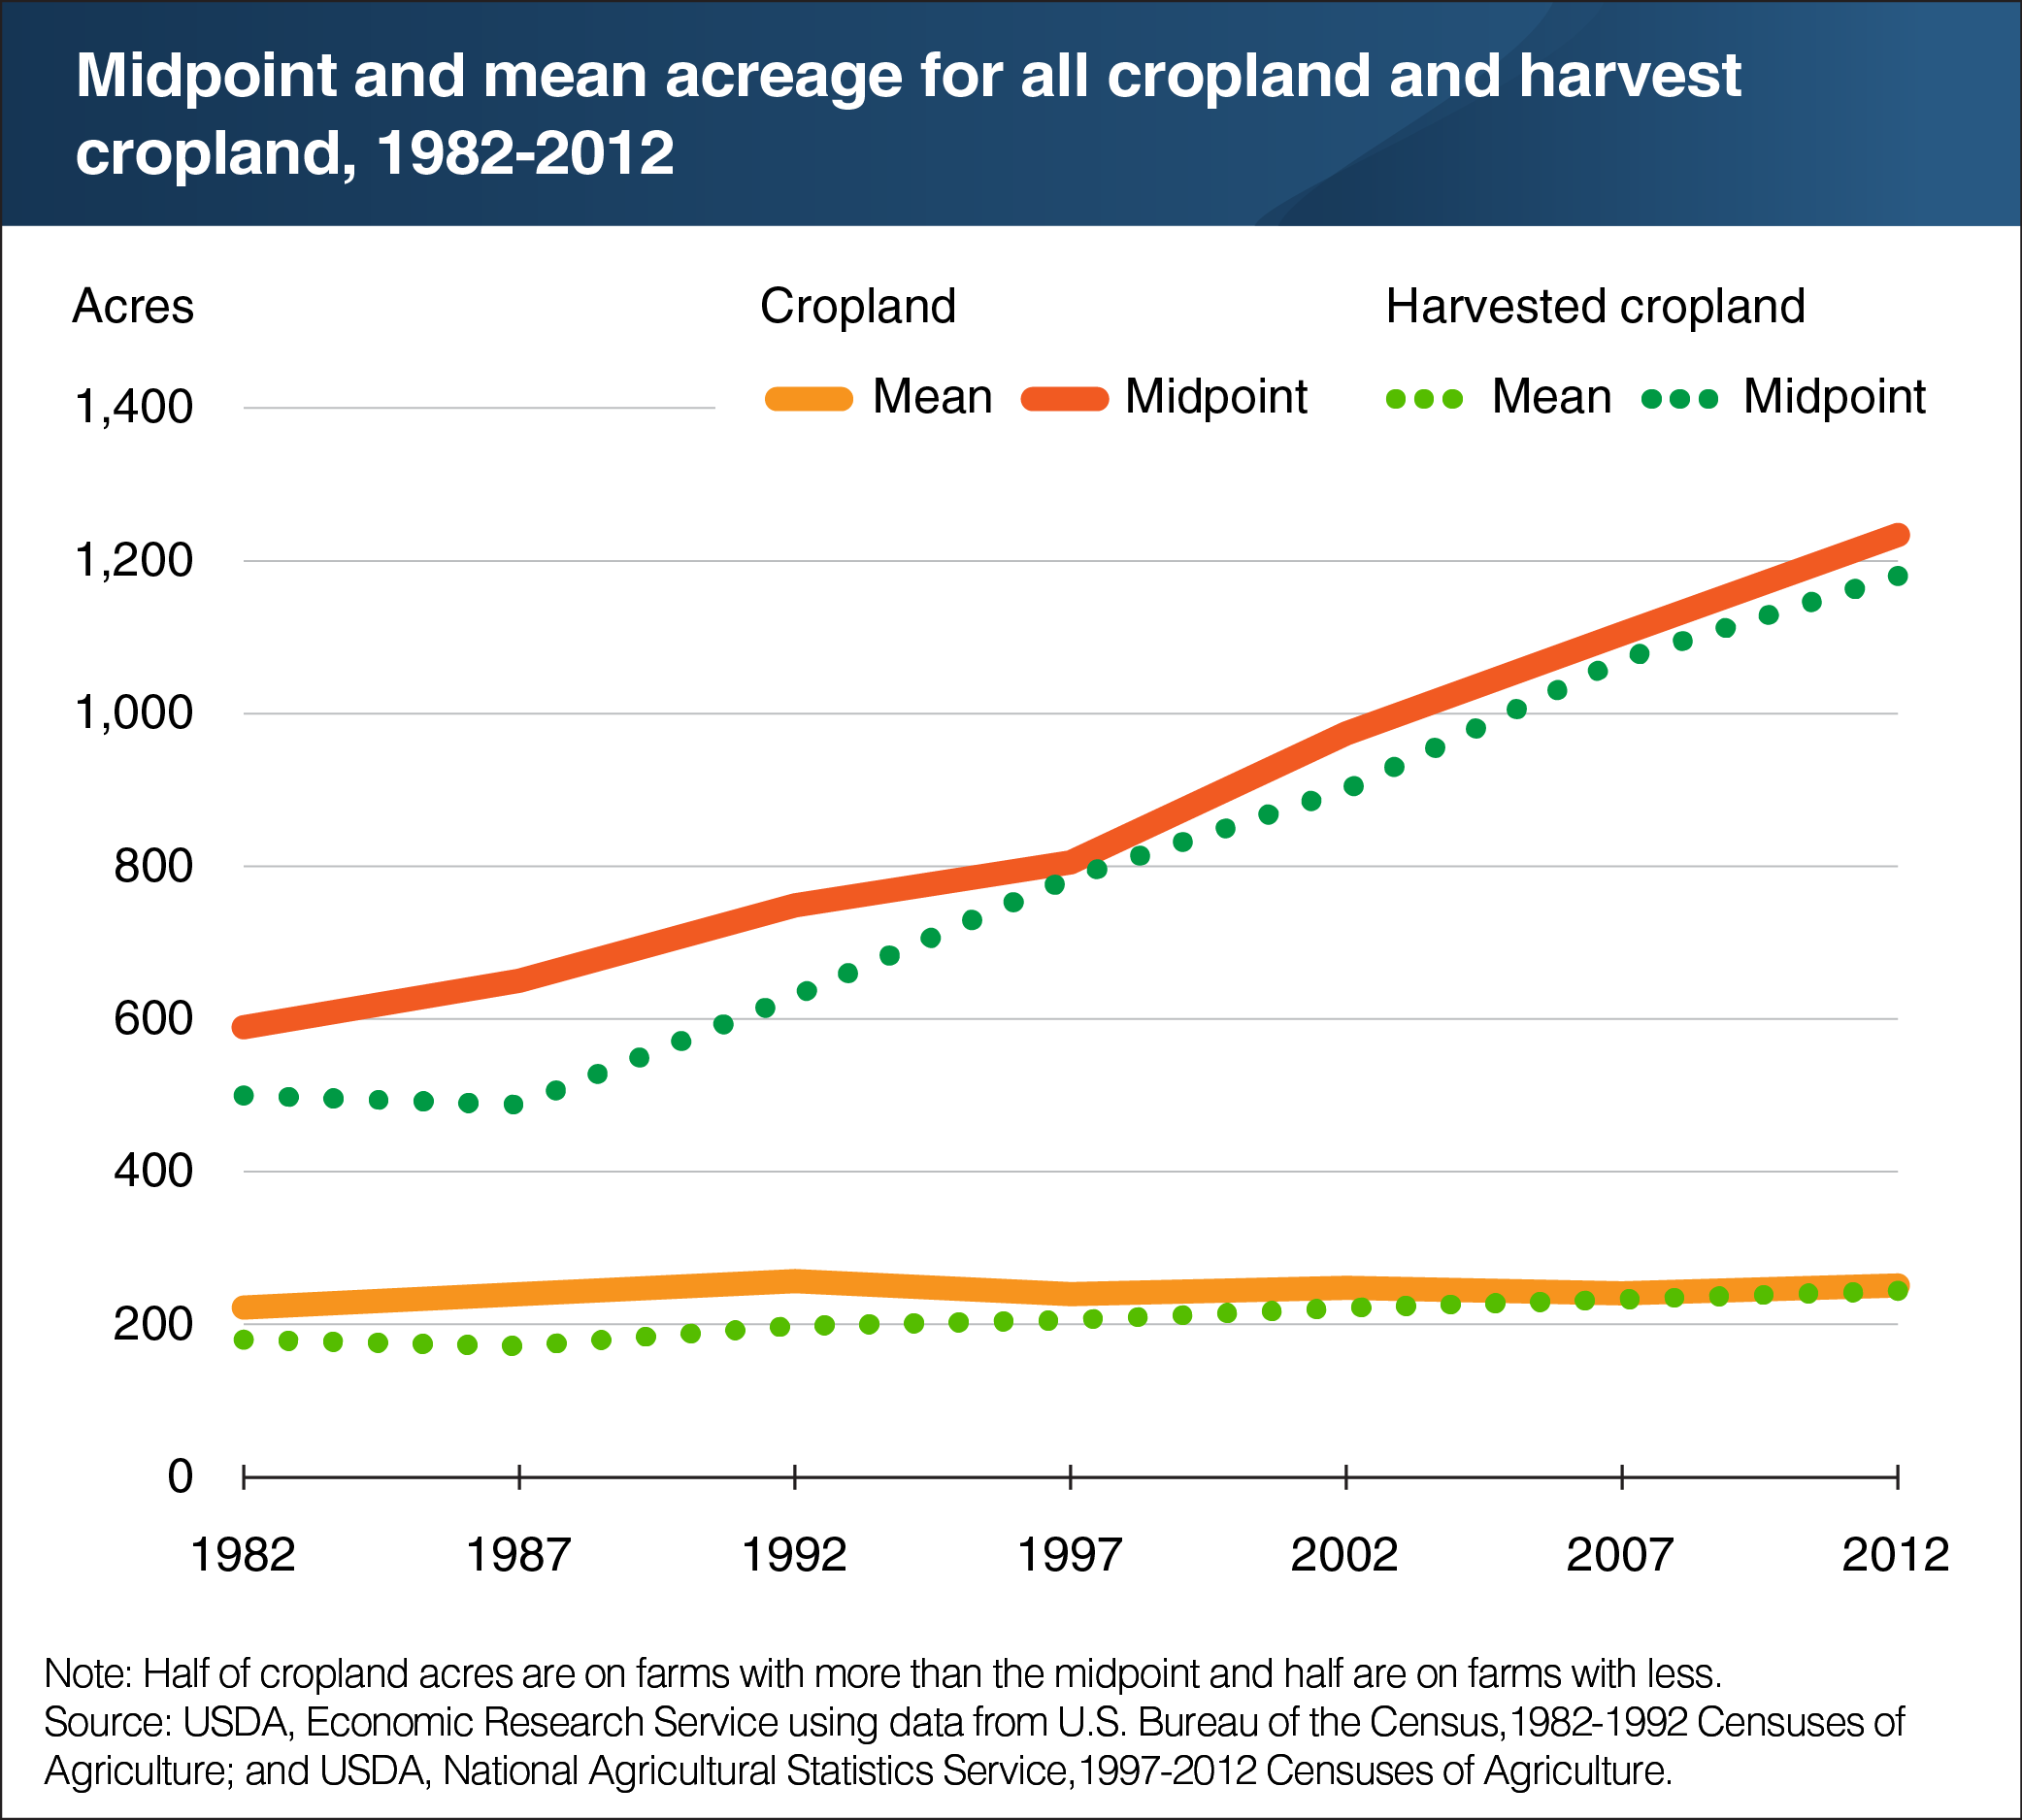
U.S. cropland has shifted to larger farms over time. However, between 1982 and 2012, the average (or mean) acres of cropland and harvested cropland changed little. Acreage averages have been stable because the largest and smallest crop farms grew in number, while farms in the middle declined. With only small changes in total cropland and total crop farms, average acreages changed minimally. The trend in midpoint acreage—at which half of all cropland acres are on farms with more cropland than the midpoint and half are on farms with less—captures the consolidation of cropland better than average acreage. As cropland shifts to larger farms, the midpoint increases. Between 1982 and 2012, the midpoint acreage for both cropland and harvested cropland roughly doubled to about 1,200 acres each. This shift was aided by technologies that allowed a single farmer or farm household to farm more acres. This chart appears in the ERS report America's Diverse Family Farms, 2016 Edition, released December 2016.