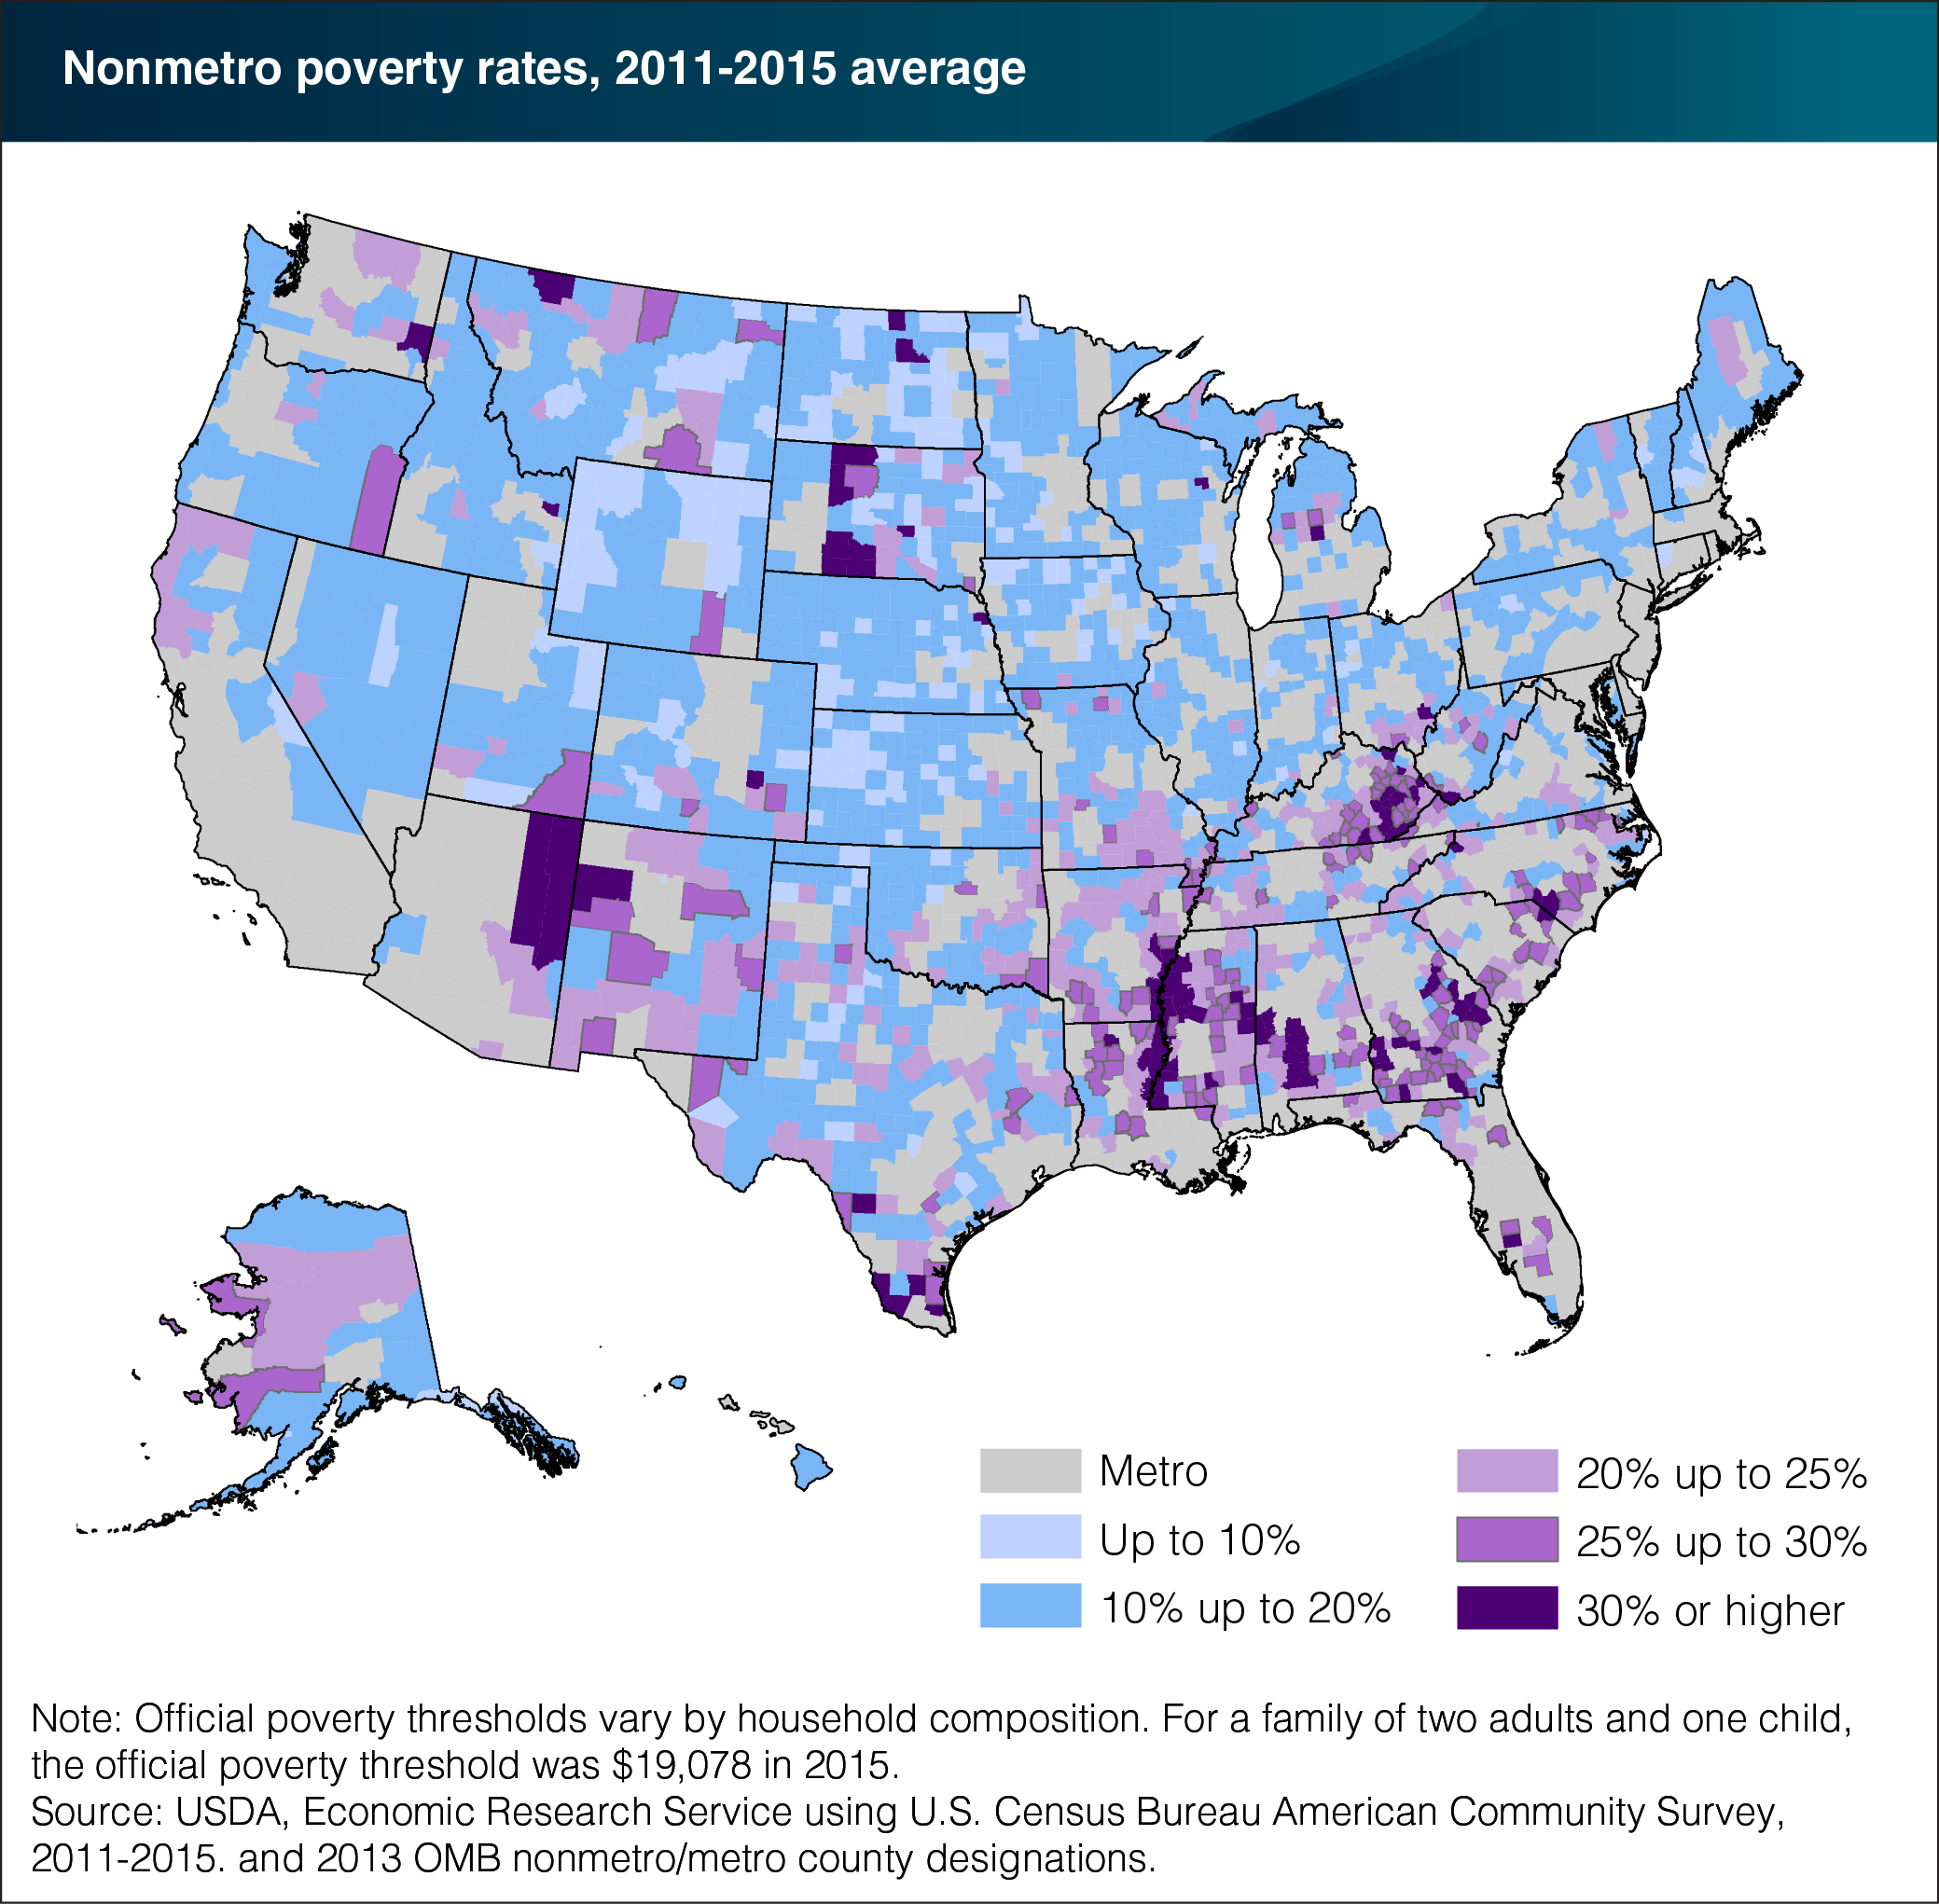
Rural poverty remains regionally concentrated
- by Tracey Farrigan
- 3/3/2017

Poverty is not evenly distributed throughout the United States. Americans living in poverty tend to be clustered in certain U.S. regions and counties. Nonmetro (rural) counties with a high incidence of poverty are mainly concentrated in the South, which had an average poverty rate of nearly 22 percent between 2011 and 2015. Rural counties with the most severe poverty are located in historically poor areas of the Southeast—including the Mississippi Delta and Appalachia—as well as on Native American lands, predominantly in the Southwest and North Central Midwest. The incidence of rural poverty is relatively low elsewhere, but generally more widespread than in the past due to a number of factors. For example, declining employment in the manufacturing sector since the 1980s contributed to the spread of poverty in the Midwest and the Northeast. Another factor is rapid growth in Hispanic populations over the 1990s and 2000s—particularly in California, Nevada, Arizona, Colorado, North Carolina, and Georgia. This group tends to be poorer than non-Hispanic whites. Finally, the 2007-09 recession resulted in more widespread rural poverty. This chart appears in the ERS topic page for Rural Poverty & Well-being, updated February 2017.
We’d welcome your feedback!
Would you be willing to answer a few quick questions about your experience?

