

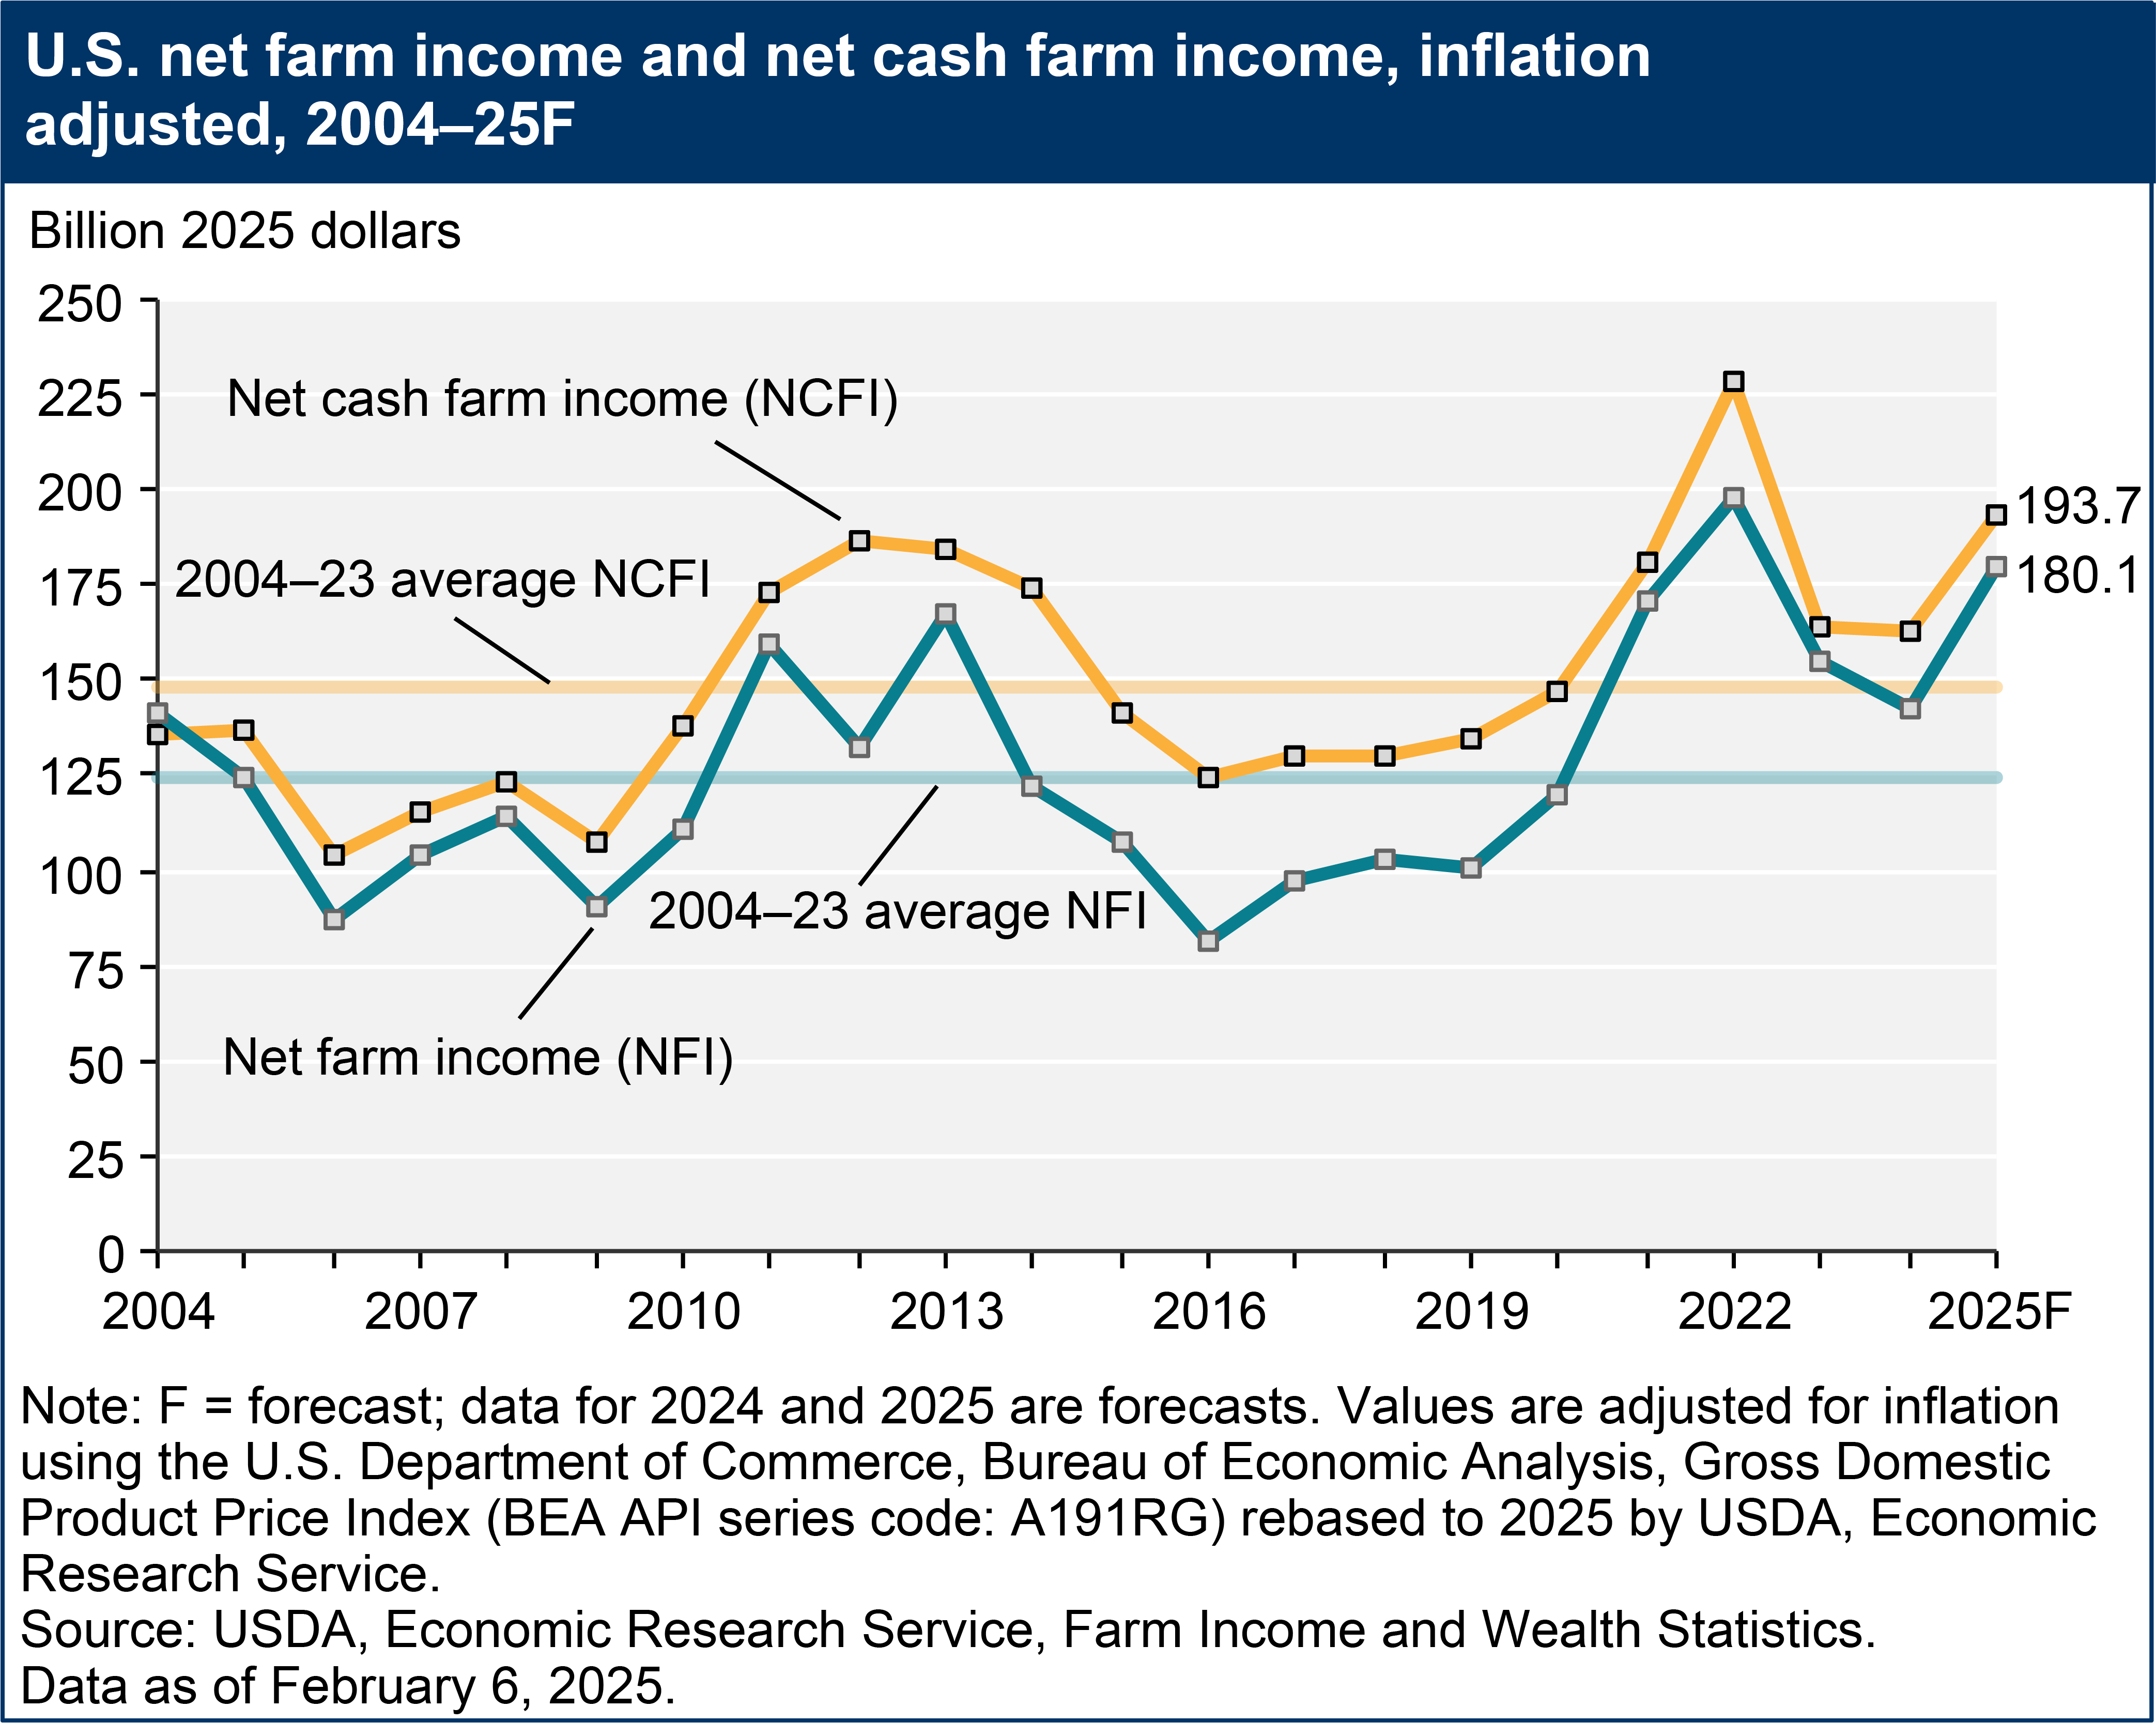
U.S. net farm income and net cash farm income, inflation adjusted, 2004–25F
- by Farm Income Team
- 2/6/2025
Download chart image | Chart data
Net farm income, a broad measure of profits, is forecast to increase in 2025 after declining in 2023 and 2024 from a record high in 2022. Forecast at $180.1 billion for 2025, net farm income would be $41.0 billion (29.5 percent) higher than in 2024. Net cash farm income is forecast at $193.7 billion for 2025, an increase of $34.5 billion (21.7 percent) relative to 2024 (not adjusted for inflation).