

Editor's Pick 2016: U.S. net farm income forecast to decline for third consecutive year in 2016
- by Farm Income Team
- 12/23/2016
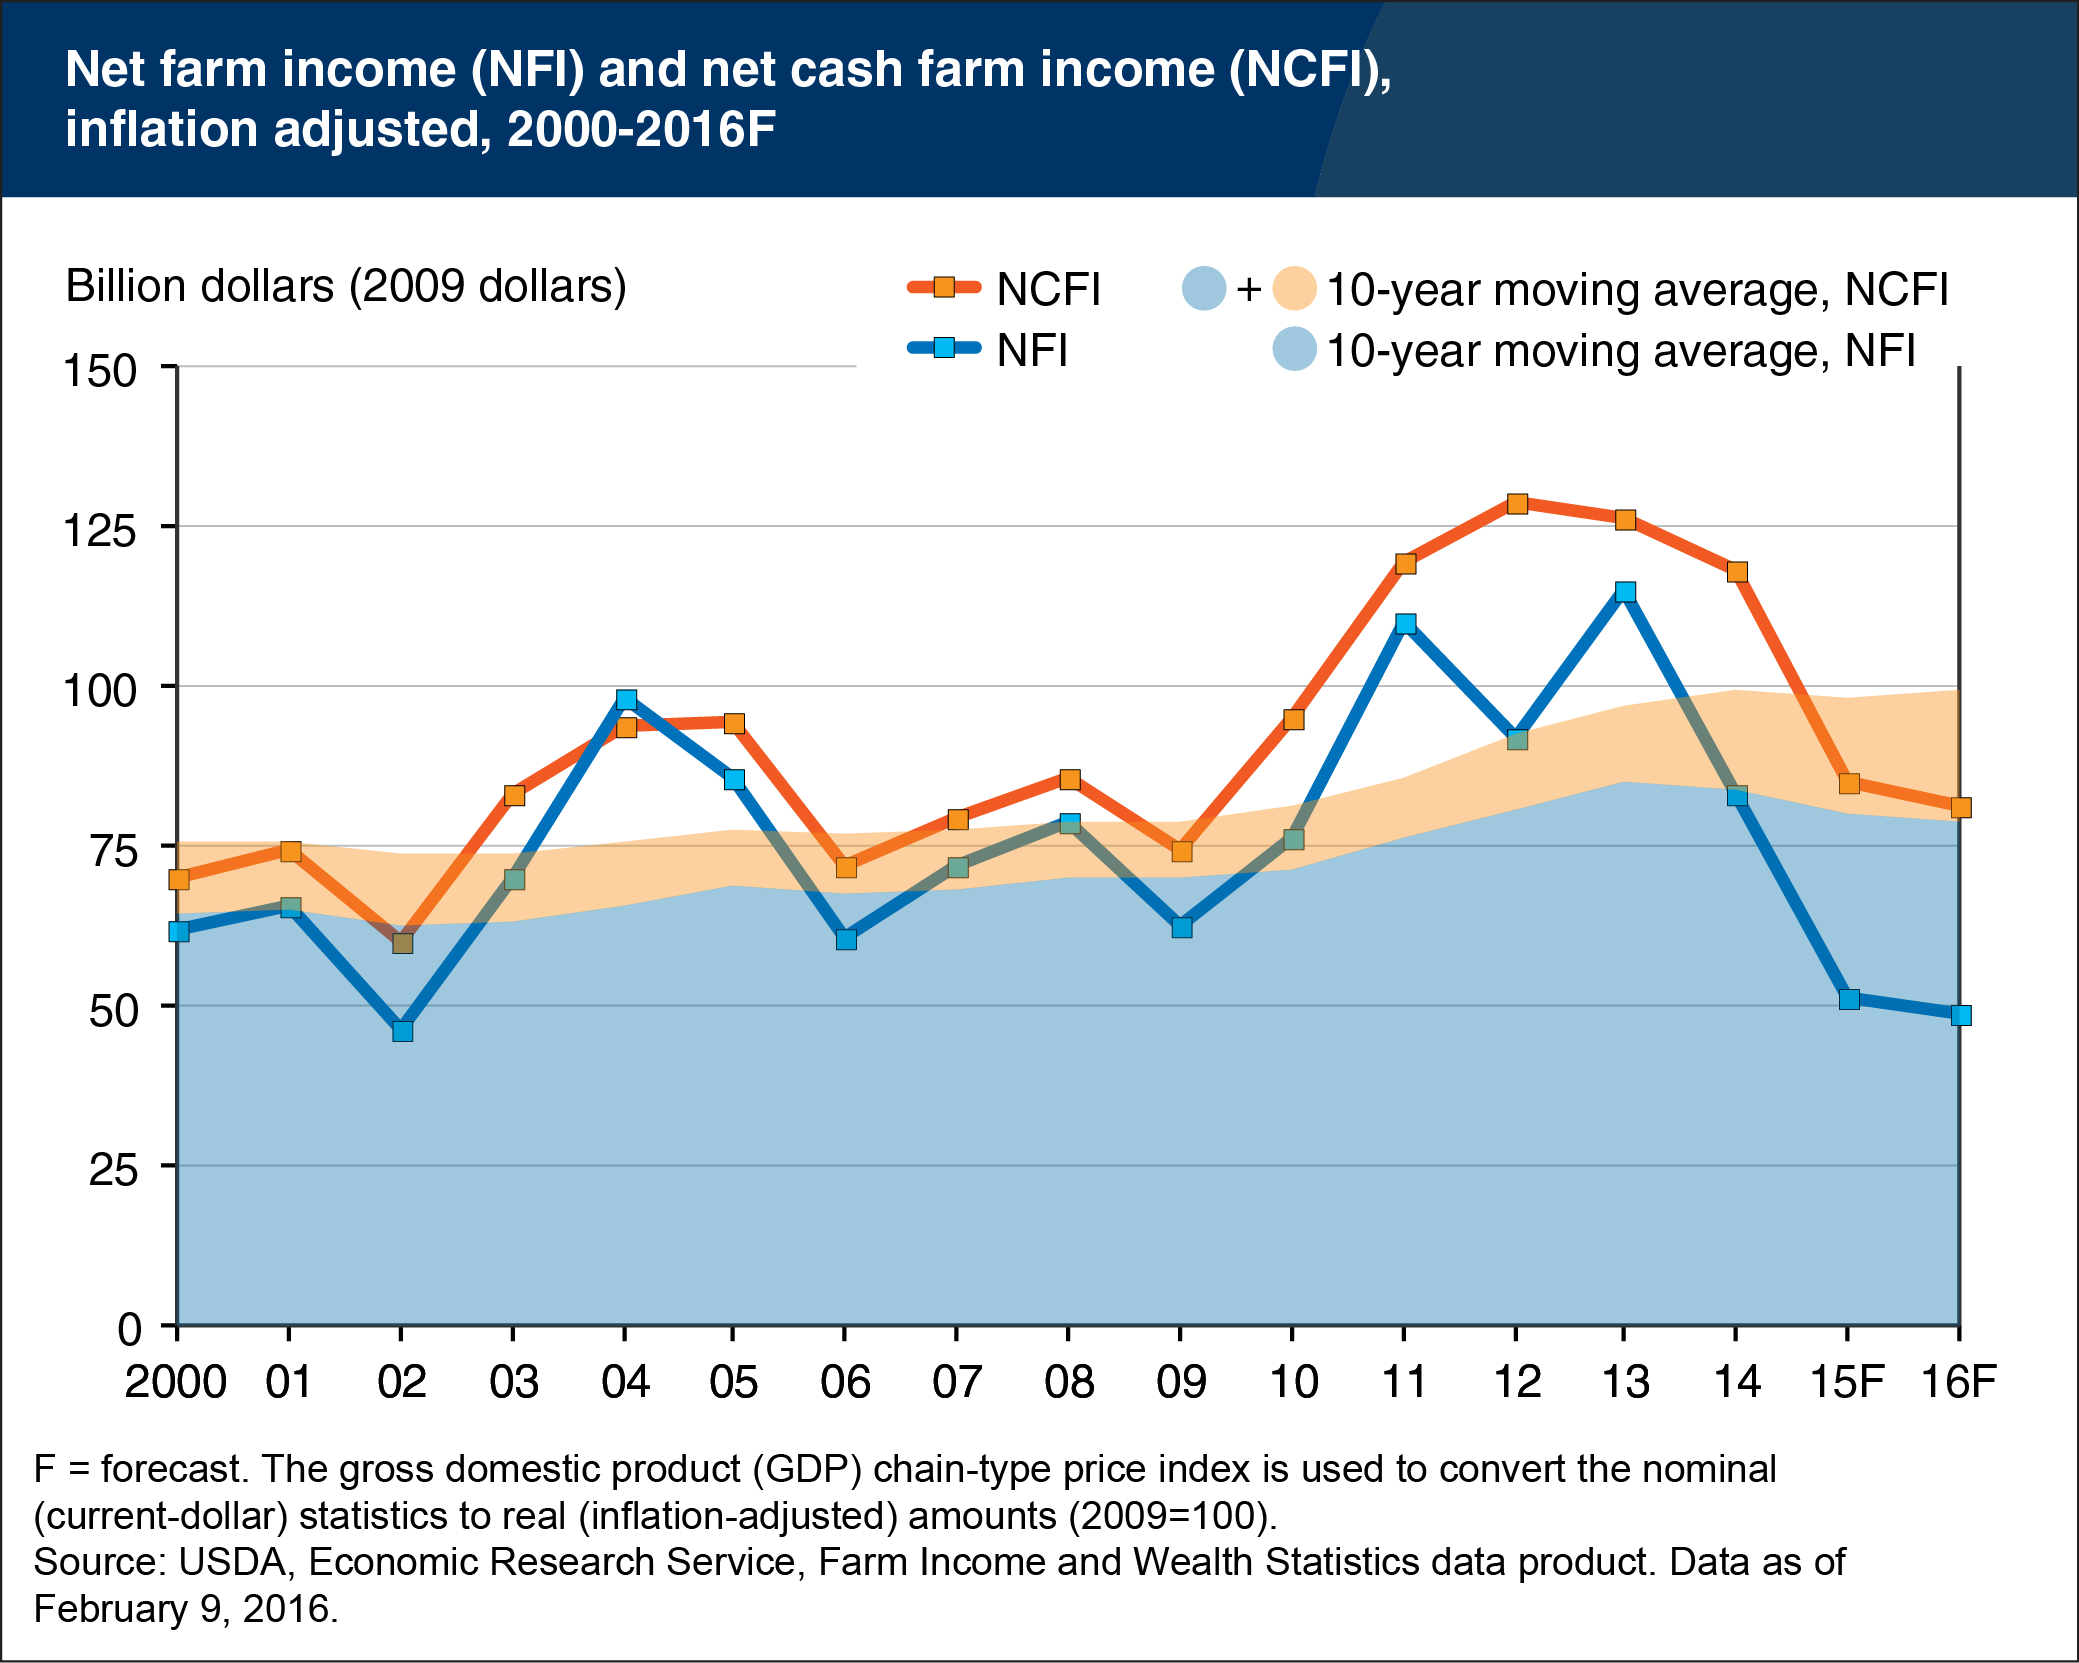
Net cash farm income and net farm income are two popular, but distinct, measures of farm sector profitability. The first measure tracks cash receipts and cash expenses, while the second also includes noncash transactions, including implicit rents, changes in inventories, capital replacement costs, and others. Following several years of high income, both measures have trended downward since 2013. ERS forecasts that net cash farm and net farm income for 2016 will be $90.9 billion and $54.8 billion, respectively, or $81.1 billion and $48.9 billion, respectively, in inflation-adjusted dollars. These amounts are below their respective 10-year average, in both nominal and inflation-adjusted terms. Before recent dips, the 10-year averages for both income measures have largely trended upward. Over the 2010 to 2013 period, surging crop and animal (including animal-product) cash receipts led net cash farm income and net farm income higher. Prices are expected to have declined for a broad set of agricultural commodities in 2015, and fall further in 2016. Production expenses are forecast to contract in 2016, but not enough to offset the commodity price declines. Find additional information and analysis in ERS’ Farm Sector Income and Finances topic page, released February 9, 2016.