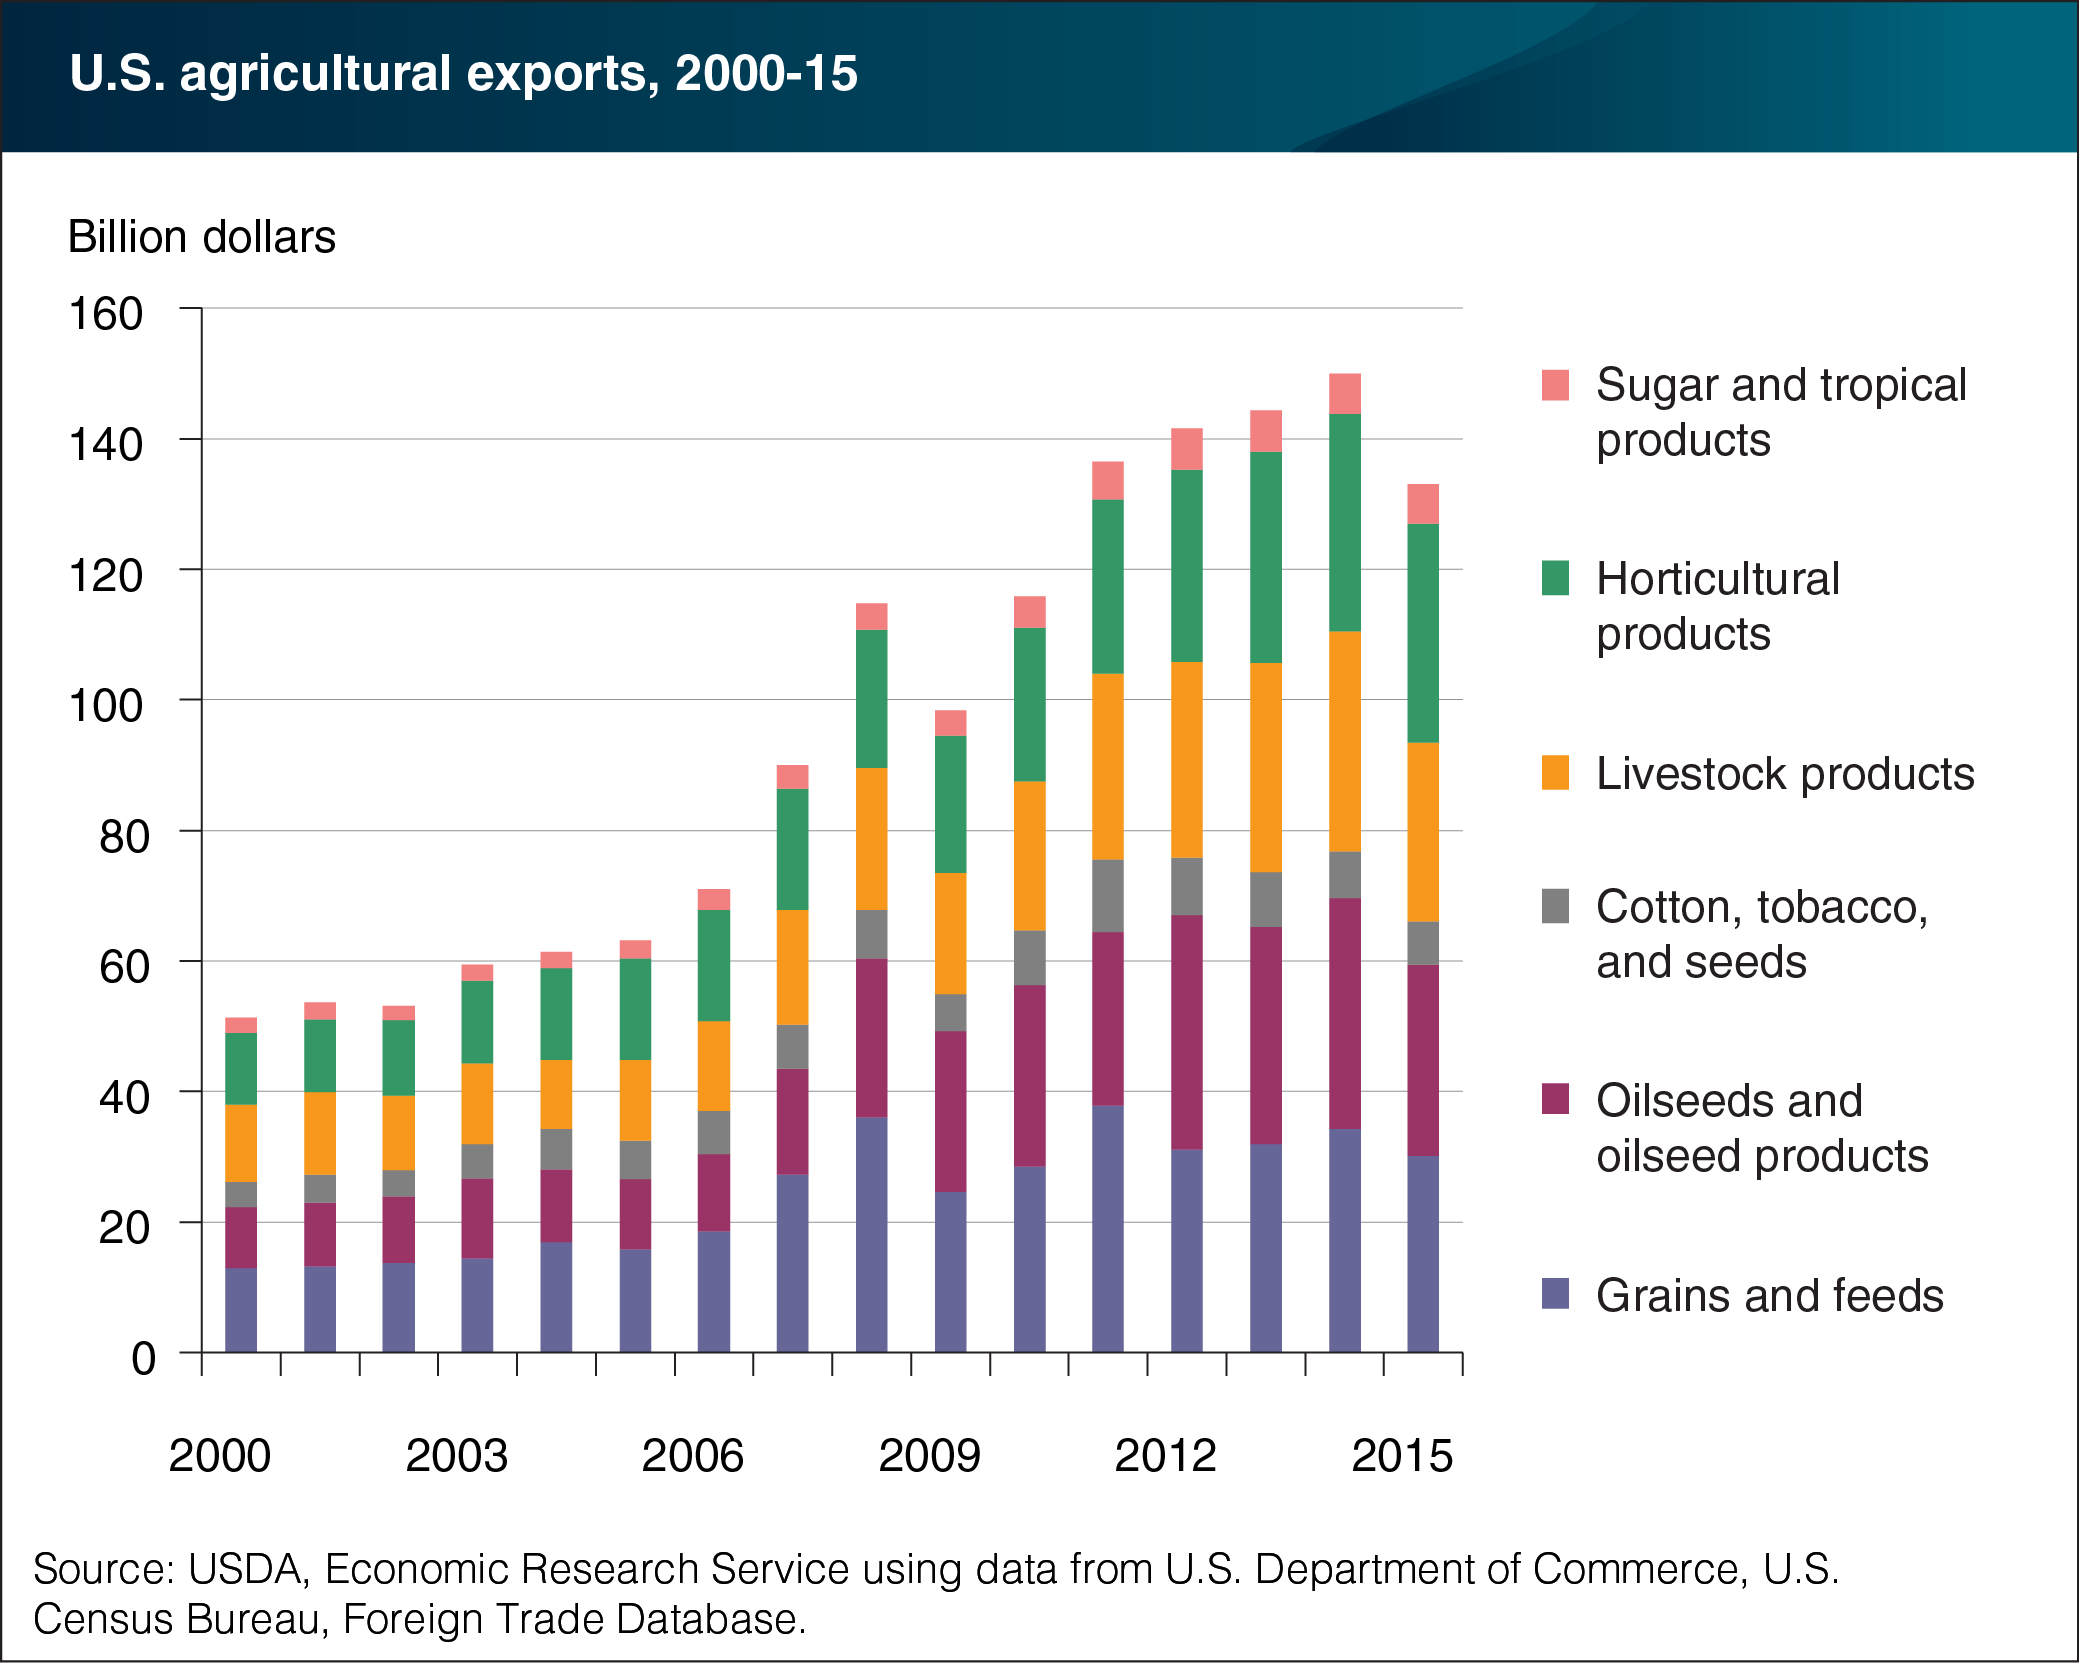
U.S. agricultural exports contain a diverse variety of products
- by Bryce Cooke
- 12/8/2016

The value of U.S. agricultural exports declined in 2015, reversing 5 consecutive years of export growth. Since 2000, developing countries—led by China—had been the main drivers of U.S. export gains. Horticultural exports were the only product group to grow in 2015, up about $266 million, increasing its share of total U.S. agricultural exports to about 25 percent. In fact, horticultural products had the largest share of any group—surpassing livestock products, grains/feeds, and oilseed/products, which had combined losses in 2015 that accounted for nearly all of the decrease in export values. The drop in export value in 2015 can be attributed, in part, to a stronger U.S. dollar relative to competitors, which made U.S. exports appear more expensive. Additionally, poultry exports were severely limited due to trade restrictions applied following the outbreak of Highly Pathogenic Avian Influenza in several U.S. states in 2015. This chart is from ERS’s Ag and Food Statistics: Charting the Essentials, updated October 2016.

