

The 30-year upward trend in eating out briefly reversed in 2007-10
- by Joanne Guthrie and Biing-Hwan Lin
- 7/5/2016
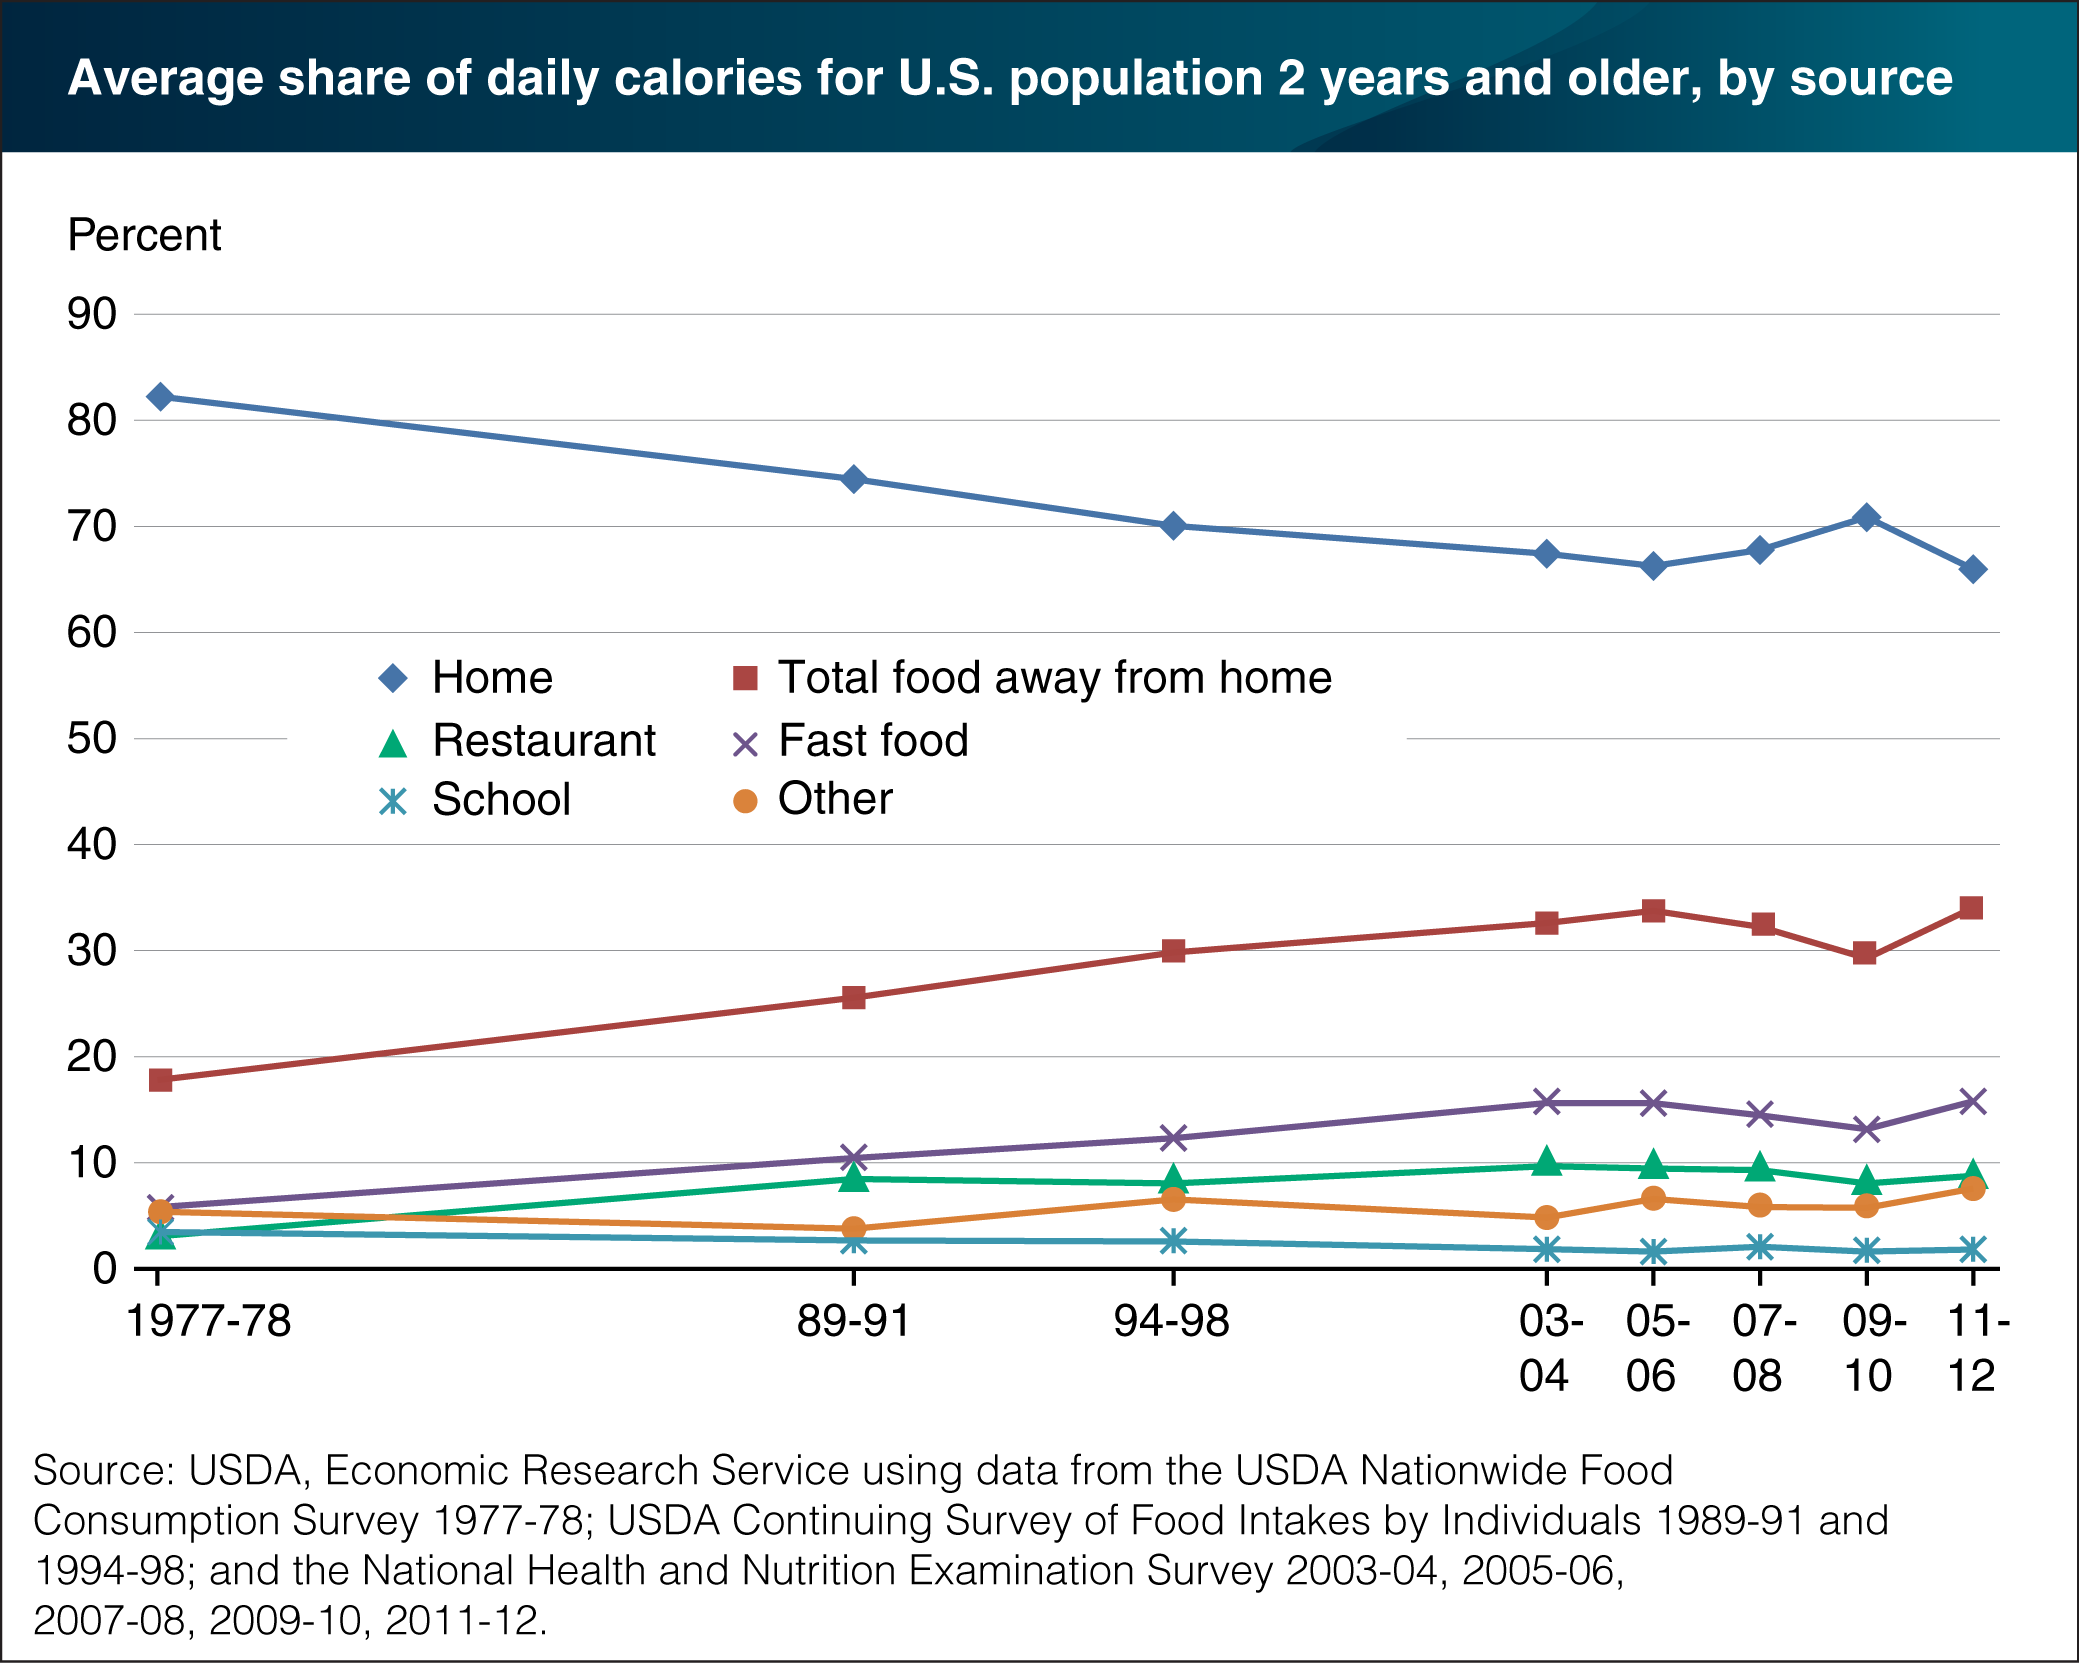
Over the past three decades, food prepared away from home—whether eaten at restaurants, picked up or delivered to eat at home, or served in school cafeterias—has become a regular part of more and more Americans’ diets. Between 1977-78 and 2005-06, the share of calories obtained away from home for the average American age 2 and older rose from 18 to 34 percent. Increased consumption of fast-food fare drove this trend. The share of calories obtained from fast food increased from 6 percent in 1977-78 to 16 percent in 2005-06. In 2007-08, the share of calories obtained away from home dropped to 32 percent and then fell again in 2009-10 to 29 percent. This period roughly corresponds to the 2007-09 recession in America—the most severe recession since the 1930s. The drop in calories eaten away from home shows that Americans economized during this time by eating out less, not just shifting to lower cost options. By 2011-12, food away from home’s share of total calories grew to 34 percent, and the fast-food share rebounded to 16 percent. This chart appears in “Linking Federal Food Intake Surveys Provides a More Accurate Look at Eating Out Trends” in the June 2016 issue of ERS’s Amber Waves magazine.