
Rising income inequality drove most of the increase in child poverty between 2003 and 2014
- by Thomas Hertz
- 5/18/2016
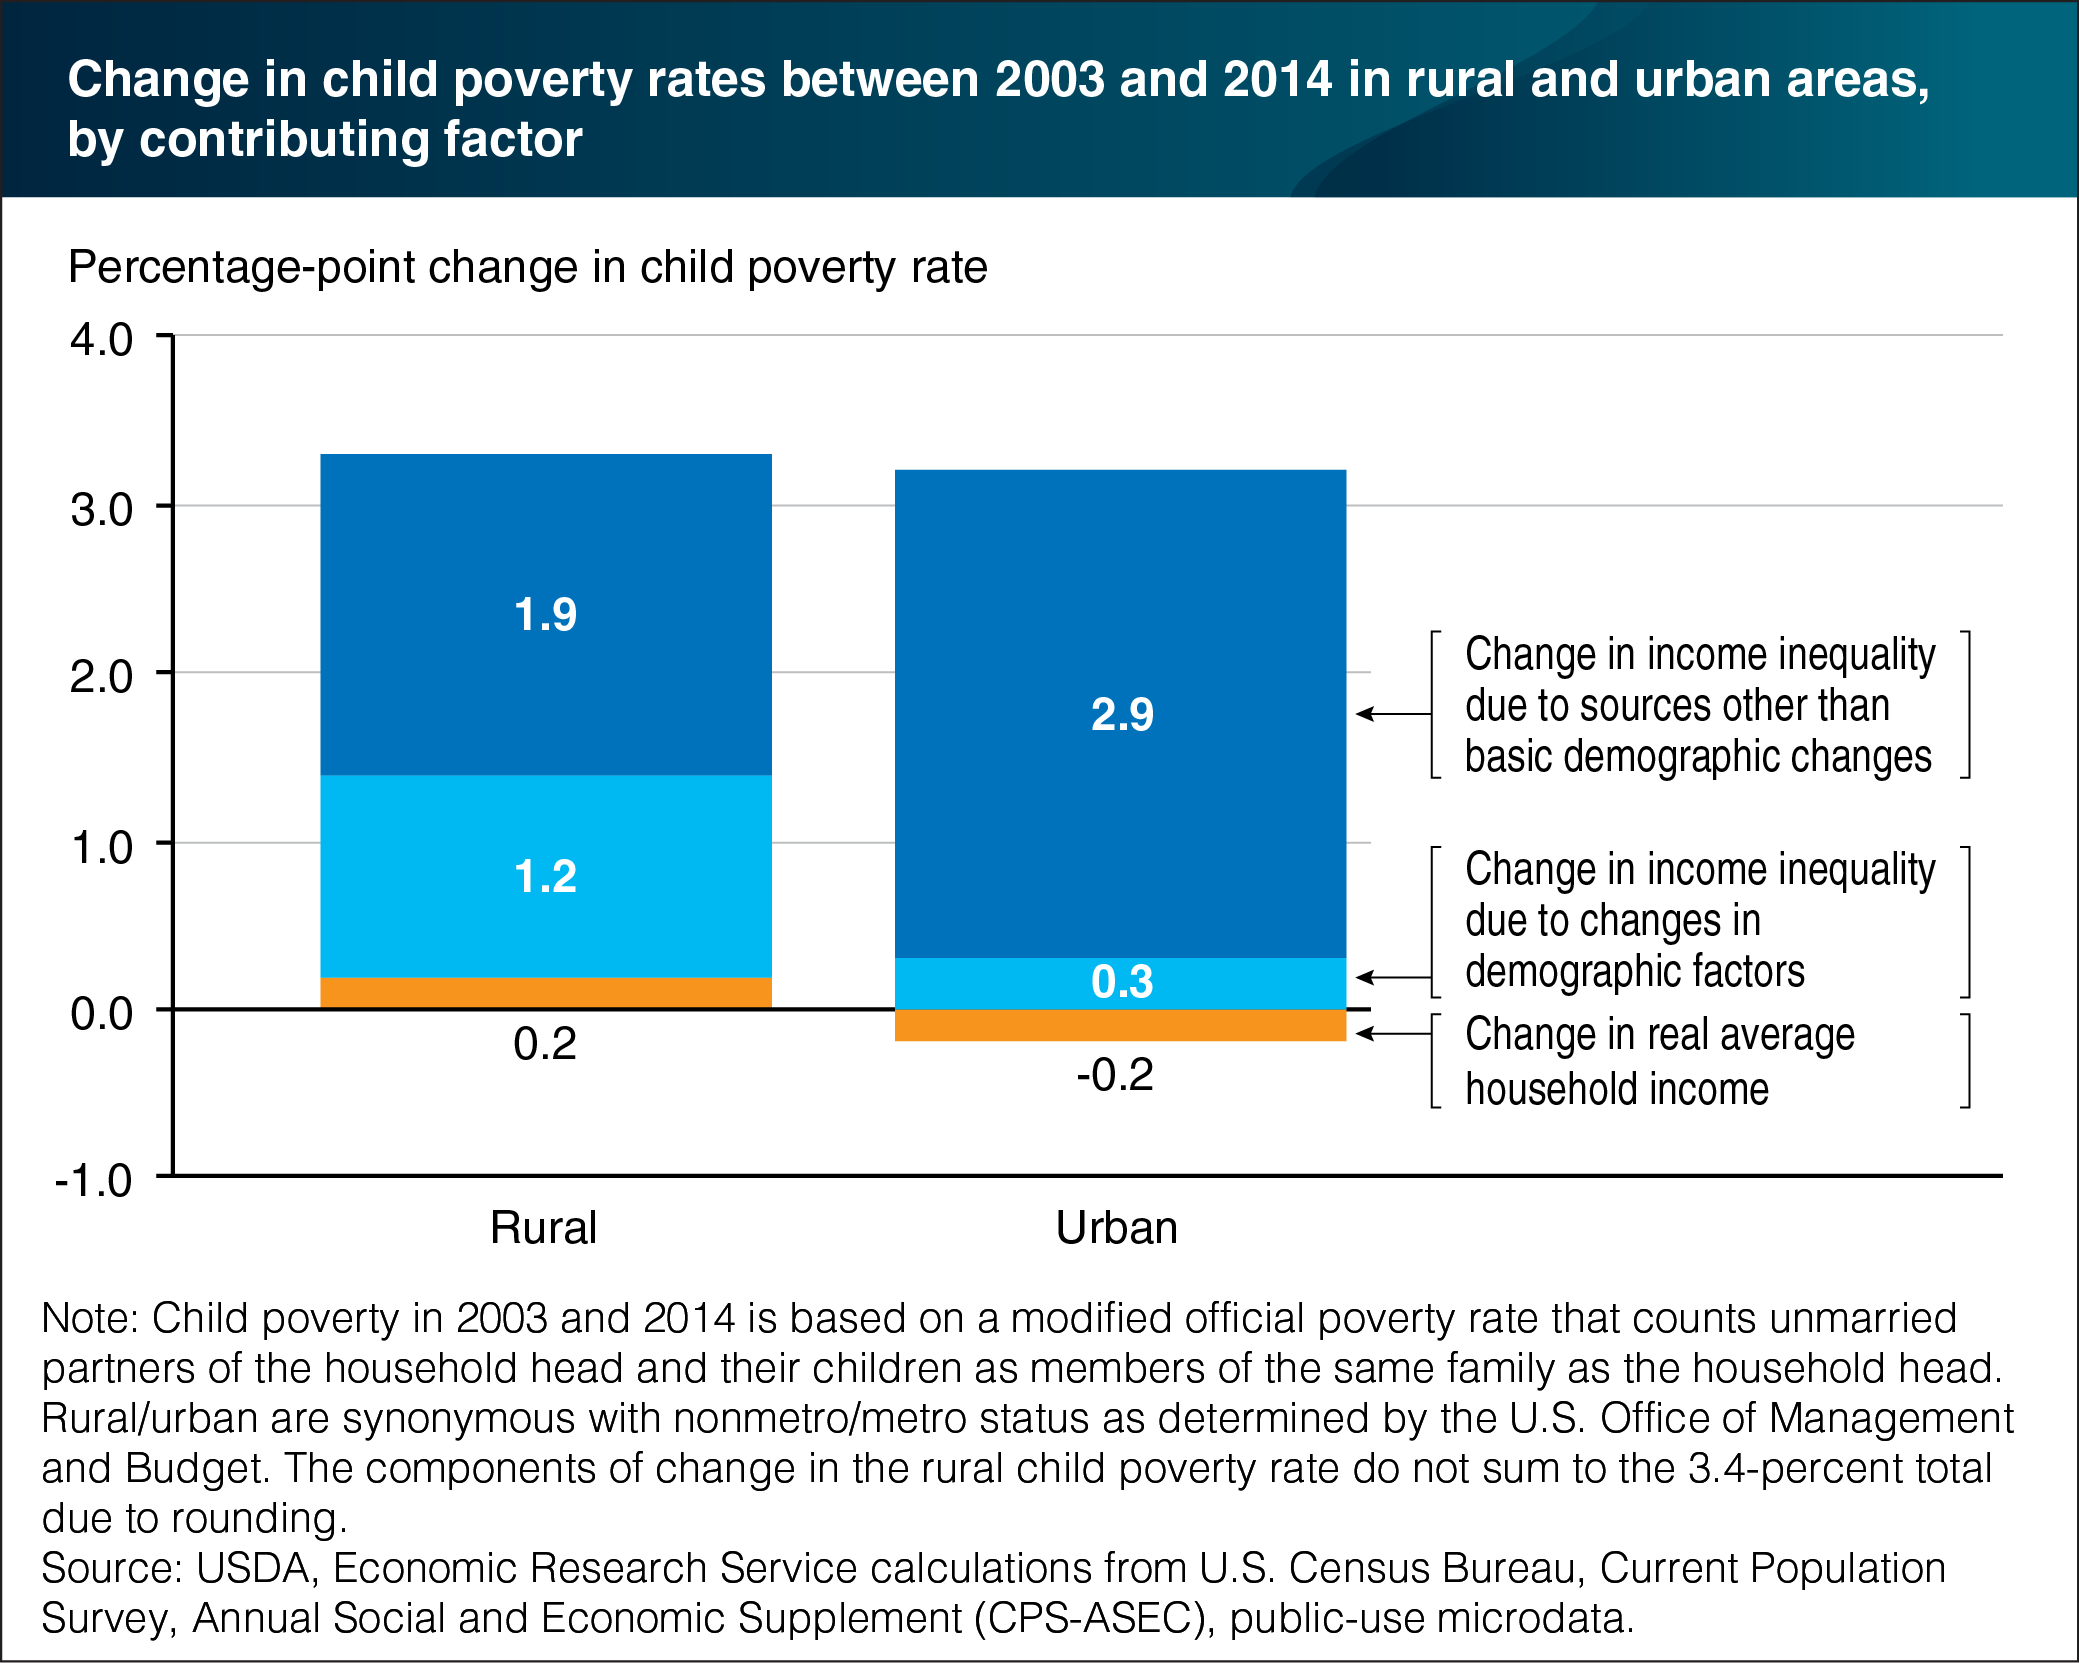
Between 2003 and 2014, the percent of children living in poverty as measured by ERS researchers increased by 3.4 percentage points in rural areas and 3.0 percentage points in urban areas. Changes in rural and urban average household income between these two dates were small, and had little effect on child poverty rates. Instead, most of the rise in child poverty was the result of an increase in income inequality, meaning that lower income families fared worse than average. In rural areas, 1.2 percentage points of increased child poverty could be attributed to changes in family characteristics and other demographic factors, including a decline in the share of children living in married-couple families, a slight decline in the number of working-age adults per family, and a slight rise in the number of children per family. The remaining increase—accounting for 1.9 percentage points in increased child poverty—reflects rising inequality within demographic categories. For urban children, family characteristics and other demographic factors had little net effect on child poverty. This chart is based on the ERS report, Understanding the Rise in Rural Child Poverty, 2003-2014, released May 16, 2016.
We’d welcome your feedback!
Would you be willing to answer a few quick questions about your experience?