
U.S. spending on food away from home higher than on food at home in 2014
- by Annette Clauson and Howard Elitzak
- 2/4/2016
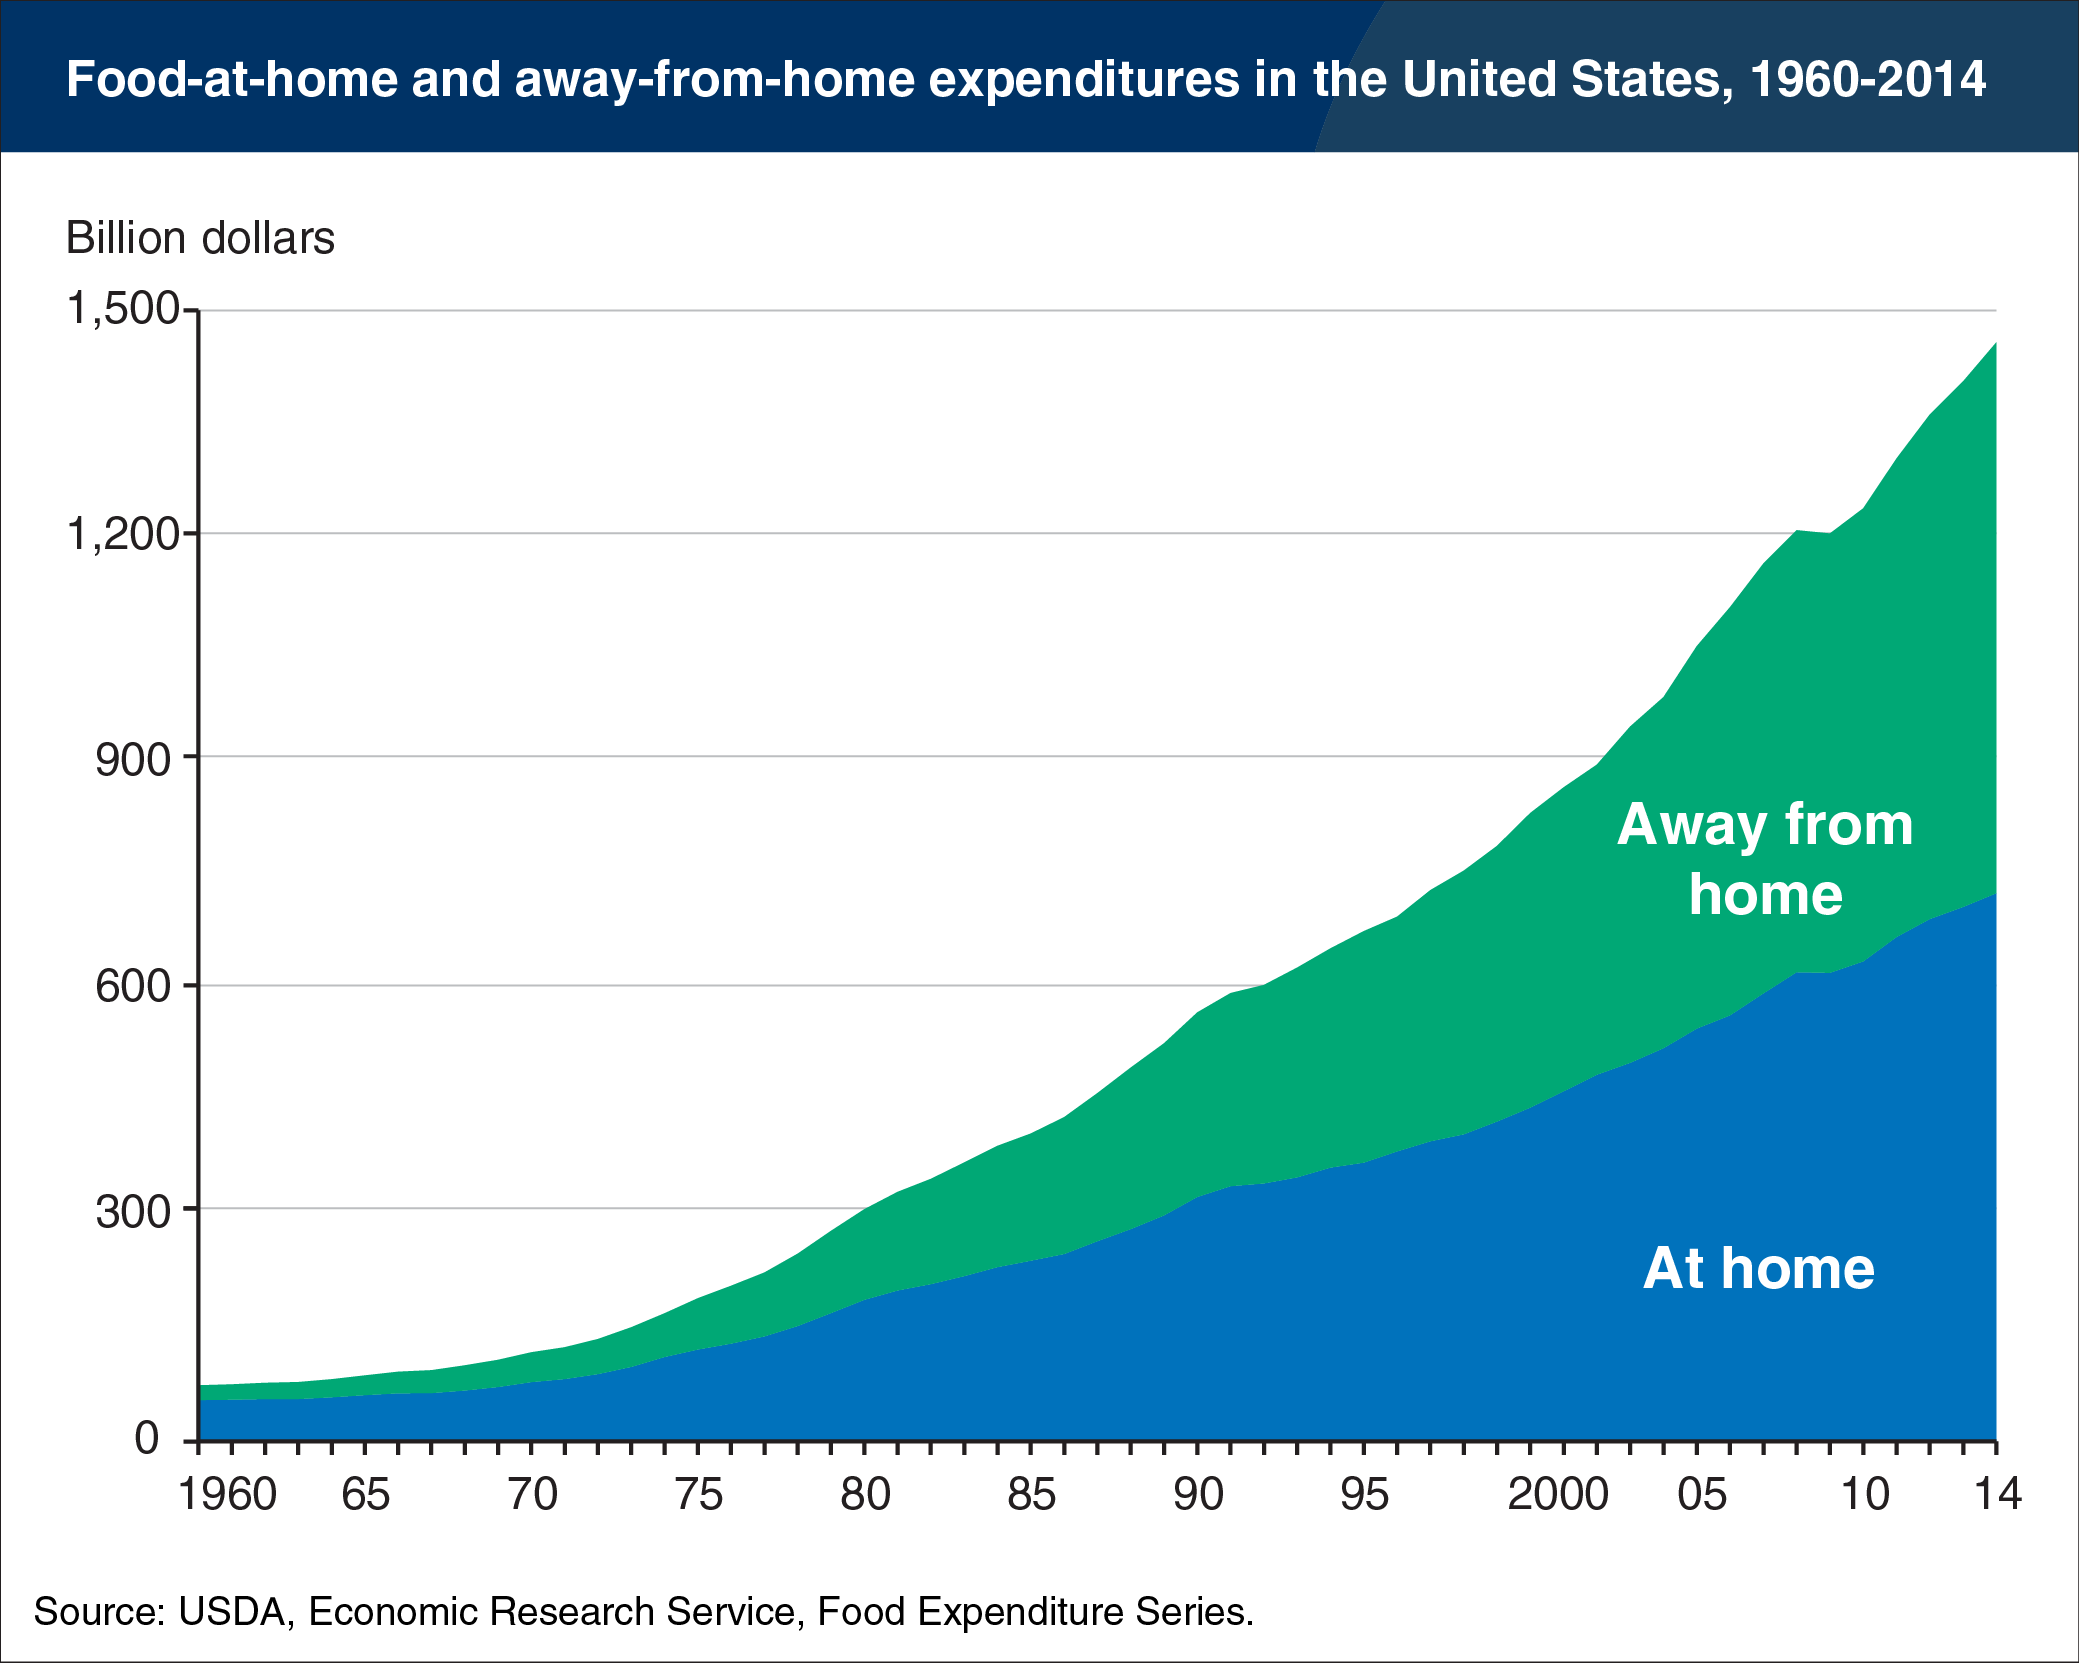
U.S. consumers spent more for food in away-from-home establishments than for meals prepared and consumed at home for the first time in 2014. Spending at food-away-from-home establishments—restaurants, school cafeterias, sports venues, etc.—accounted for 50.1 percent of the $1.46 trillion spent on food and beverages by U.S. consumers, businesses, and government entities. The remaining 49.9 percent took place at grocery stores and other retailers. A 50.1-percent share of food expenditures does not equate to 50.1 percent of food quantities, as food purchased away from home is generally higher priced than food prepared at home. Food-away-from-home outlets incur costs for the variety of workers required to prepare and serve food, as well as for buildings, equipment, and utilities. The away-from-home market, which had a 26.3-percent share of total food expenditures in 1960, saw its share grow through the decades, except in some recession years. During the 2007-09 recession, food away from home’s share of total food spending dipped from 49.0 percent in 2007 to 48.5 percent in 2008 and did not rebound to its pre-recession share until 2012. The data for this chart are from ERS’s Food Expenditures data product, updated on January 26, 2016.